6 Best Network Traffic Analysis (NTA) tools (Paid & Free) – Updated 2023

Network traffic analysis involves examining packets passing along a network. Historically, this strategy was intended to investigate the sources of all traffic and volumes of throughput for the sake of capacity analysis.
More recently, network traffic analysis has expanded to include deep packet inspection used by firewalls and traffic anomaly analysis used by intrusion detection systems.
Mục lục bài viết
The diversity of traffic analysis purposes can be seen in the list of the best network traffic analysis tools:
- SolarWinds NetFlow Traffic Analyzer
EDITOR’S CHOICE
The leading network traffic analyzer. It works with NetFlow, J-Flow, sFlow, NetStream, and IPFIX for packet capture.
- ManageEngine OpManager Plus
(FREE TRIAL)
An expansion of the standard OpManager network performance monitor that includes traffic analysis. - Noction Flow Analyzer This is a package of network monitoring tools that include a capacity planning analyzer that recalls stored traffic data. Runs on Linux.
- Elastic Stack A suite of data capture and analysis tools featuring Elasticsearch and Kibana.
- Plixer Scrutinizer A traffic analyzer used for network security that samples traffic from multiple network locations simultaneously.
- Open WIPS-NG A wireless network protection system that includes traffic analysis.
What to look for in a network traffic analysis tool
At the simpler end of the market, you will find packet sniffers that copy passing traffic into files. That information then needs to be processed to gain meaningful insights into traffic patterns. At the other end of the scale, you will find complex systems that sample traffic from several points of the network simultaneously. They can also consolidate that source material to discover unusual user behavior.
Although the network offers live source data, network traffic analysis tools rarely operate in real-time. Packet headers are the main source of information for analysis, but traffic analyzers wait until a series of packets have been captured and stored. So, NTAs can be said to operate at the Application Layer and not the Network Layer.
Analyzing at the Application Layer gives the NTA tool a better overview of network activity. The information available at the Network Layer is insufficient to spot overall traffic patterns and it misses malicious traffic that is intentionally spread across numerous packets or combines actions from different sources.
Network traffic analysis can give rapid feedback, but at its fastest, it is only “nearly live.” Security applications can’t detect threats until they have streams of data to work on. With capacity planning and analysis, there is less urgency – the accuracy of projections is more important than immediacy.
Related post: Network Capacity Planning Tools
The NTA utility that will interest you the most depends on the reason you need to analyze your network.
Our methodology for selecting NTA tools for this list
We reviewed the market for network traffic analysis software and assessed the options based on the following criteria:
- A monitor that is able to use traffic flow protocols, such as NetFlow, J-Flow, and sFlow to communicate with switches and routers
- Options for packet capture or packet sampling
- A protocol analyzer to segment traffic statistics by application
- The ability to identify traffic volumes per link and end-to-end on a given path
- Live traffic data displayed in graphical format
- A free trial for a no-cost assessment period or a completely free tool
- Free tools that are worth installing or paid tools that offer value for money
The descriptions of each tool in the following sections should help you to decide.
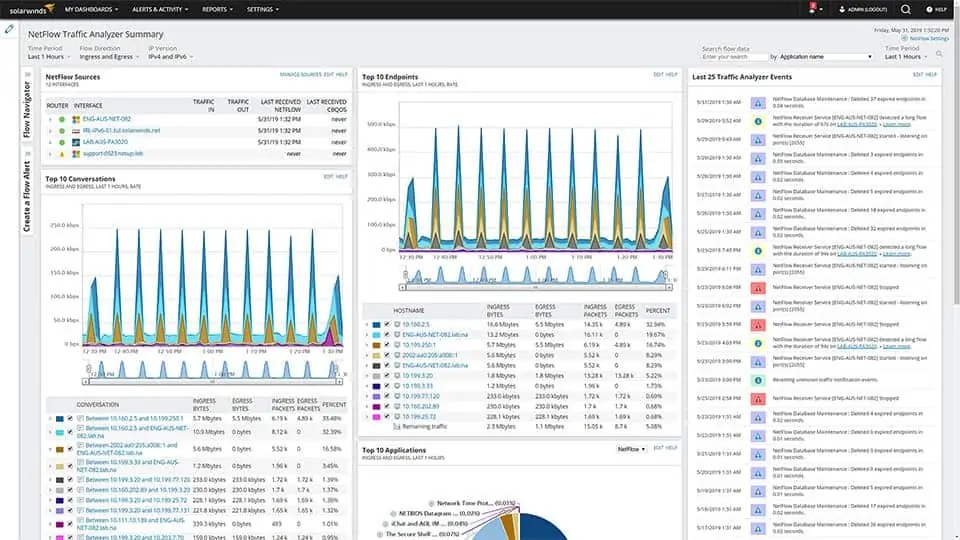
The SolarWinds NetFlow Traffic Analyzer is available as a standalone monitor or as part of the Network Bandwidth Analyzer Pack, which also includes the Network Performance Monitor. The NetFlow Traffic Analyzer uses the packet analysis utilities built into network equipment to get packet samples and throughput metrics. These systems include Cisco NetFlow, J-Flow from Juniper Networks, and Huawei’s NetStream, plus the sFlow and IPFIX systems. The tool also interprets NBAR2 data from Cisco devices.
Key Features:
- Uses NetFlow, J-Flow, sFlow, NetStream, and IPFIX
- NBAR2 for traffic classification
- QoS analysis
- Good for VoIP
- Resolves bottlenecks
It is possible to watch this collected data live on the screen. However, the real analysis only takes place on stored data. The utility is able to identify VLANs, such as simultaneous voice traffic on the network. Live data features include throughput thresholds that will alert you if traffic starts to push to the limit of the network’s capacity.
The data analysis screens will show the top traffic generating applications and it can also segment data by source and protocol/port. Time-based charts display the peaks and troughs in traffic volumes over hours, days, or months. This will enable you to assess the times of peak demand so that you can shift batch jobs and downloads to less critical hours.
Remediation tools in the utility include traffic shaping measures, that you can implement and manage queue-based traffic shaping measures, such as Class-based Quality of Service.
Pros:
- Lets you track traffic from point to point
- Shows congested devices
- Identifies big traffic generators
- Provides protocol analysis
- Assists with implementing traffic shaping
Cons:
- No SaaS version
Both the Network Performance Monitor and the NetFlow Traffic Analyzer will cover LANs, wireless networks, WANs and connections to Cloud services. Both of these tools install on Windows Server and they are written on a common platform, so they can interact. This data exchange enables a number of common modules, including PerfStack, which shows the underlying resources supporting each application and their live statuses. You can get a 30-day free trial of the NetFlow Traffic Analyzer.
SolarWinds also offers a 30-day free trial of the Network Bandwidth Analyzer Pack.
Related post: SolarWinds NetFlow Traffic Analyzer Review
EDITOR’S CHOICE
Great for capturing continuous streams of network traffic data and presenting raw numbers into easy-to-read charts and tables. Gives a quality bird’s-eye-view of how much traffic is on the network and the applications that are being used on it.
Get 30 Day Free Trial: www.solarwinds.com/netflow-traffic-analyzer
OS: Microsoft Windows Server 2016 & 2019
ManageEngine OpManager Plus includes just about all of the monitoring capabilities that you need to run your IT infrastructure. This includes network device health monitoring and traffic flow analysis utilities.
Key Features:
- NBAR for protocol scoring
- Uses NetFlow, J-Flow, sFlow, NetStream, Appflow, and IPFIX
- CBQoS
- Wireless network monitoring
OpManager Plus starts its service life by scanning the network and creating a topology map and device inventory. That gives you an overview of your network and then you can work on testing the traffic on each link or end to end between two nodes on the network. Whenever you change the layout of the network by moving, adding, or removing equipment, the topology map and inventory will update automatically. The map shows the status of each device and the load on each link.
The traffic flow capture system in the monitor can communicate with network devices through NetFlow, IPFIX, J-Flow, NetStream, sFlow, and AppFlow. Metrics on network traffic are displayed live on the screen. However, the packets captured by the system are stored in files for analysis.
The day-to-day traffic monitoring system allows you to set threshold alerts that warn of possible resource exhaustion. These alerts can be sent to you by email or SMS so you don’t have to attend the monitoring screens constantly.
The analysis screens of the system help you to explore the sources of traffic by application, IP address, or interface – it implements NBAR. The tool includes forecasting assistance so that you can perform capacity planning. The system also includes traffic shaping tools, such as queuing and prioritization with Class-Based QoS to help you squeeze extra value out of your network infrastructure.
OpManager Plus can monitor wireless networks as well as standard LANs. It can cover internet links between sites if you run a WAN and it is also able to integrate links to Cloud servers.
Pros:
- Versions for Windows Server and Linux
- Covers both wired and wireless networks
- Can operate across the internet to monitor WANs
- Offers traffic shaping measures
Cons:
- Will install on cloud platforms but it isn’t a SaaS package
The software for OpManager Plus can be installed on Windows Server or Linux servers. ManageEngine offers OpManager Plus on a 30-day free trial.
ManageEngine OpManager Plus
Download 30-day FREE Trial
Related post: ManageEngine OpManager – Full Review
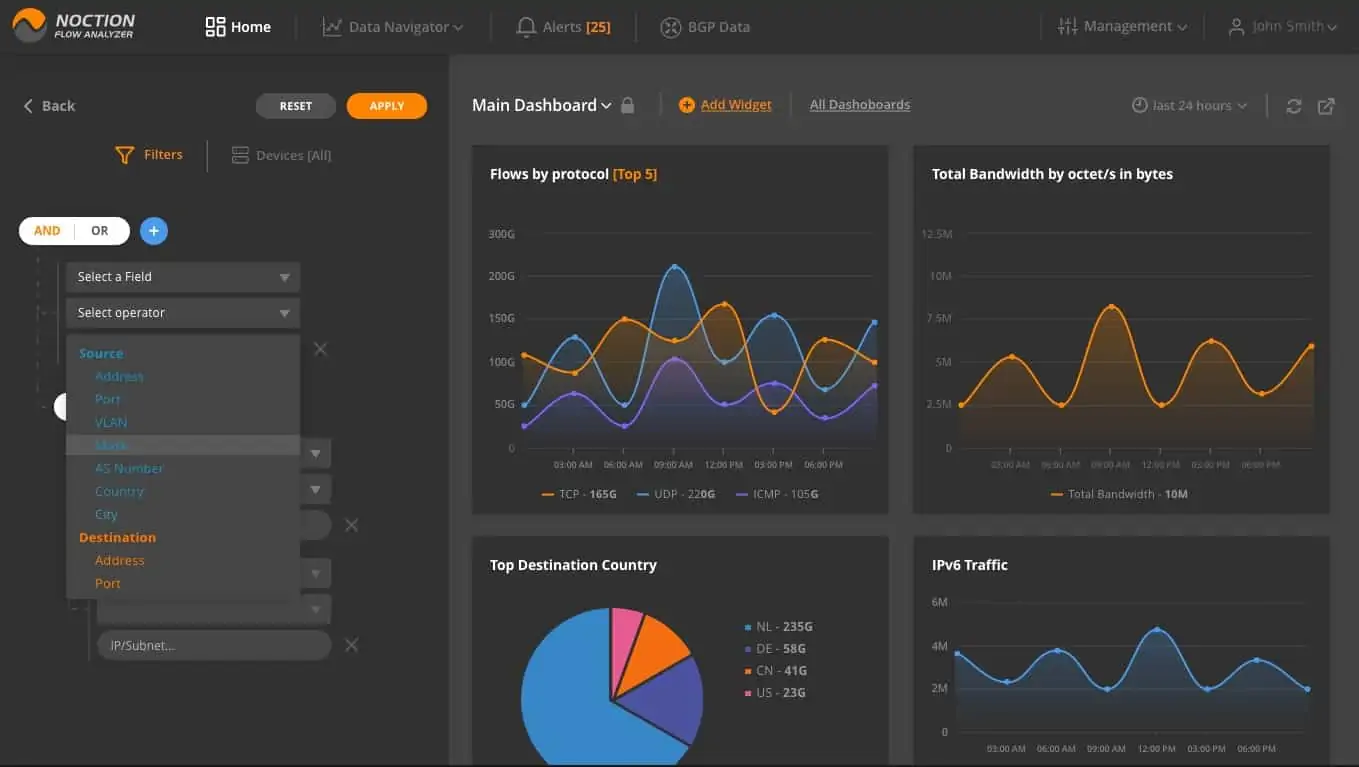
Noction Flow Analyzer is a package of network traffic analysis systems for bandwidth monitoring, capacity planning and BGP data evaluation. The analyzer relies on data collected by the network traffic monitor. While interpreting the collected data and displaying it in the system dashboard, the Noction system also stores it. That data is collected from switches and routers.
Key Features:
- Uses NetFlow, J-Flow, sFlow, NetStream, and IPFIX
- Internet route analysis
- Network traffic monitoring
The data collector uses the NetFlow, IPFIX, sFlow, NetStream, and J-Flow systems to communicate with network devices. This range of capabilities is necessary because many equipment manufacturers have created their own statistical querying language, which is pre-loaded on their devices. Other manufacturers rely on the industry standards, sFlow and IPFIX. By including the capability to use all of these systems, Noction has made the Flow Analyzer able to monitor multi-vendor sites.
The analyzer will display traffic data related to a requested period. This data can be filtered and sorted to focus on the traffic generated by each protocol. It is also possible to identify the traffic volumes generated by each endpoint and which endpoints receive more traffic than others.
The traffic analyzer enables you to predict future bandwidth requirements for the network and alter its architecture accordingly.
Various alerts can be set up in the Alerts section. Notifications can be sent to technicians via email or Slack. That means the IT Operations staff can assume that the network is operating well unless they are notified.
Pros:
- Identifies network and internet routes
- Tracks traffic flows
- Network capacity planning features
Cons:
- You host the software yourself but pay a subscription
Noction Flow Analyzer installs on Linux – Ubuntu, CentOS, or RHEL. The system is charged on a subscription basis with a rate per month and per year. You can get a free trial to examine Noction Flow Analyzer for yourself.
Netherlands-based Elasticsearch B.V. has hit on a very successful niche market with Elastic Stack. Many software buyers feel restricted by the all-inclusive packages of monitoring and analysis systems and would prefer to select the best-of-breed for each network analysis function. Elastic Stack works together in order to capture packets, analyze them, and display the results but each element can be deployed separately and used in concert with tools from other providers.
Key Features:
- Free version
- Hosted option
- Modular and flexible
The business started up with its Elasticsearch product and still carries that name for the company. This tool searches through logs and stored packet streams. It then derives statistics from those searches. You use this search engine as an analytical tool.
Kibana is the frontend of Elastic Stack. This is the star of the stable and is widely recommended by many other network analysis tools. There are many open-source network traffic analysis tools out on the market that have been developed by geniuses that just can’t be bothered with a presentation. These very good systems skip the trouble of creating a dashboard and just tell their users to install Kibana instead.
Kibana was built to interact with many backend data gathering and interpolation systems, such as OSSEC. However, it was specifically written to work with Elasticsearch. The tool has very attractive data visualizations and the screens can be customized. The interoperability with Elasticsearch means that the queries you perform in Kibana get implemented by Elasticsearch, with the results returned to the Kibana data interpretation system.
Logstash is the lowest layer of Elastic Stack. This is a log server and can create storage files for a wide range of data. For traffic analysis, you could use a free pcap tool to feed into the stack via Logstash.
Pros:
- A group of useful tools for collecting, analyzing, and viewing data
- Create your own application
- Interpret data into graphs and charts
Cons:
- Not a pre-wrtten traffic analyzer
The Elastic Stack programs are free to use and they are available for Windows, Linux, and macOS. Elastic Stack is also available in a supported version for a fee. There is a Cloud-based service for Elastic Stack, called Elastic Cloud.
Related post: Best J-Flow Monitoring Tools
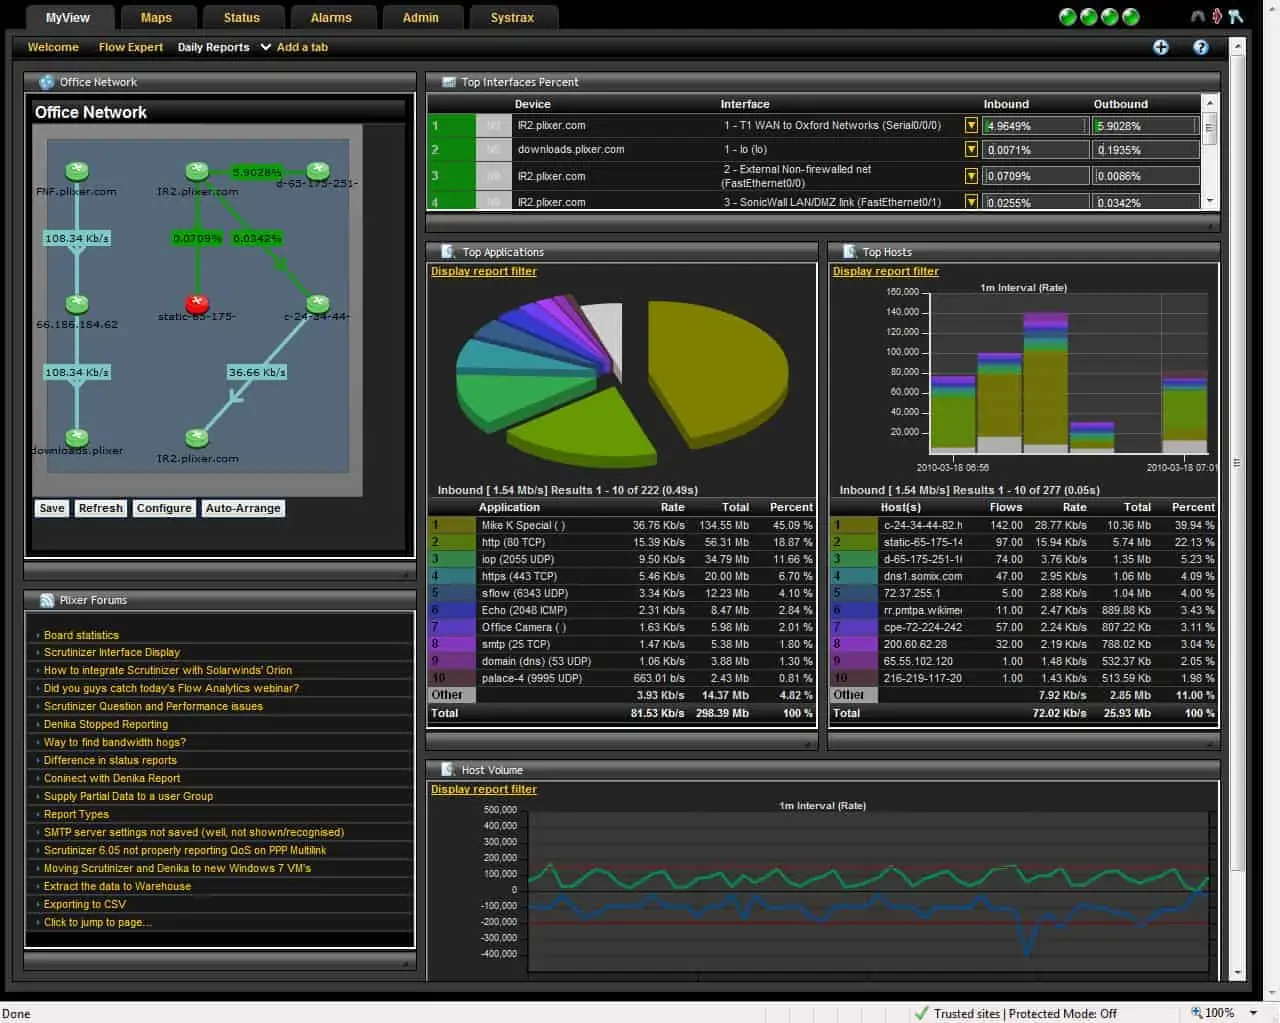
Plixer Scrutinizer is a stand-alone traffic analyzer that is available as an appliance, as a virtual appliance, or as a Cloud service. The focus of this tool is to identify security threats and its full name is the Scrutinizer Incident Response System.
Key Features:
- Uses NetFlow, J-Flow, sFlow, NetStream, and IPFIX
- Deployment options
- Processes large volumes of traffic data
Scrutinizer gathers packets and metrics with NetFlow, IPFIX, NetStream, J-Flow, and sFlow. The system communicates with switches, routers, firewalls, servers, and wireless access points. Data collection occurs simultaneously at many points on the network. All of the passing data is shown in live graphs as it occurs, but it is also stored for security analysis. The multiple viewpoints can be useful for traffic analysis as well as for security processes because they show up bottlenecks in the system.
All of that data gathering produces very large volumes of information – up to 10 million flows per second. However, the Scrutinizer interpolation engine is built to handle that much volume. Although the system is intended to work with stored data, it operates on a sliding window and gets started including new data as soon as it comes in. This gives it a “near live” capability that is able to spot security breaches almost immediately. You don’t have to wait to find out a couple of days later that there has been a serious problem. Incidences appear as override alerts in the system performance monitoring screens.
Pros:
- Offered as an appliance, a virtual appliance, or a SaaS package
- Security threat analysis
- Traffic management
Cons:
- No options to integrate with IT asset management systems
Scrutinizer is marketed on a subscription model with three service levels: Free, SSVR, and SCR. As you would expect, the free version has data throughput caps volume limits and fewer utilities than the paid editions.
Paid plans allow you to schedule data collection and reporting. The paid plans can be accessed for free on a 30-day trial.
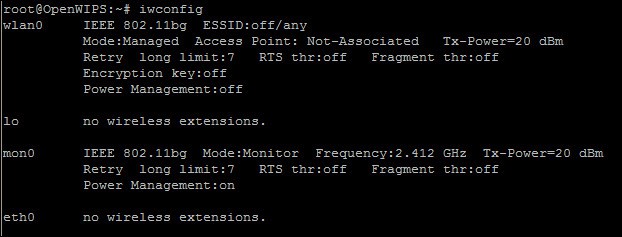 Open WIPS-NG is an intrusion prevention system for wireless networks. This is a free tool that includes intrusion detection and automated responses. The tool is a sister product to Aircrack-NG, which is well known as a hacker utility.
Key Features:
- Wireless networks
- Packet capture
- Free to use
The traffic analyzer includes three elements: a sensor, a data processor, and an interface. The sensor is a two-way communication channel, so it acts as an implementor of mitigation strategies when any malicious activity is spotted.
The sensor is a wireless packet sniffer. It collects packets constantly and sends them to a file. The file is a source for the server program, which implements detection rules, looking for signs of intrusion. The results of security checks are displayed in the interface.
Remediation can be implemented automatically. If an intruder is spotted, the server program sends a command to the wireless AP via the sensor to kick that user off the network.
Pros:
- Security monitoring through traffic capture
- Options for automated responses
- Aggregates data to identify patterns of malicious activity
Cons:
- Getting old
- No support
Open WIPS-NG is an open-source project. The software can only be run on Linux.
Exploring network traffic analysis
As this report makes clear, there are two main reasons to conduct network traffic analysis: network performance enhancement and security checks. This guide aimed to rate the best in both of these worlds. If you have a favorite network traffic analysis tool that isn’t on this list, leave a message in the Comments section below and share your experience with the community.
Network Traffic Analysis FAQs:
Why is it important to perform a network traffic baseline definition analysis?
A baseline provides you with a pattern of normal behavior on your network. It is useful to establish regular traffic patterns per application. This allows you to detect abnormal activity if traffic for a specific protocol suddenly rises.
What is network traffic analysis?
Network traffic analysis can be used for capacity planning and also for security monitoring. In both cases, analysis of the headers of circulating data packets can give you a running total of traffic per endpoint and per protocol. With a stored history of traffic patterns, you can identify unexpected increases in traffic per source and per protocol.