Bitcoin’s Intermediate-term Elliott Wave Review
Mục lục bài viết
Previous Elliott Wave Analyses
In my previous update, see here, I reviewed the shorter-term Elliott Wave Principle (EWP)-count for Bitcoin (BTC). I found,
“The Bullish count is preferred if BTC can stay above ~$19500 and rally back above $23000. However, if BTC closes below $19500, it opens up the door to $19000, and from there, ~$17000 is the most likely ideal downside target (wave-v = wave-i).”
Last week BTC topped at $22377 and is now trading at $19300s after testing the critical $19K level. Thus, it failed to rally above $23K and is now below $19,500. The trap door has been set for the cryptocurrency to reach $17K. However, is it possible it might even go lower? The weekly chart I last shared in May, see here, has been updated.
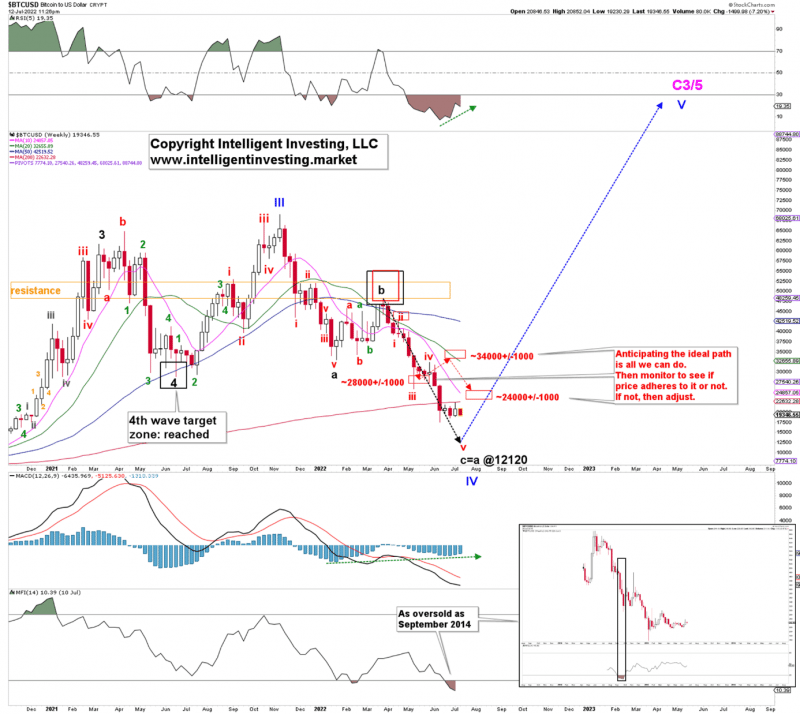
The ideal path then pointed to a low in the $24+/-1K zone, but the waves decided to subdivide/extend. As always, all we can do is “anticipate the ideal path”, then we “monitor to see if price follows it or not,” and if not, then we must “adjust.” Why? Because we are dealing with a stochastic, probabilist environment and not something that is set in stone.
Figure 1. Bitcoin weekly chart with detailed EWP count and technical indicators.
$12K Cannot be Excluded Just Yet
The classic, ideal, standard c=a extension (See Figure 1 above) targets ~$12K. Given BTC has already dropped below the ideal $24+/-1K target zone and the short-term Fibonacci-based EWP count suggests $17K, it is certainly possible for the cryptocurrency to fall to $12K.
Besides, given that I am still missing a more significant wave to around $100+K (see here) this would mean a 10x multiplication factor. Given the rally from the March 2020 low to the November 2021 high was a factor of ~20, whereas the rally from the January 2015 low to the December 2017 high was a factor of ~100, the law of diminishing returns applies nicely.
Money Flow Indicator
The very oversold Money Flow Indicator (MFI14) is an essential piece of information. It currently sits at 10. The last time this indicator was similarly oversold was September 2014 (See insert Figure 1). Back then, BTC rallied for a few weeks into November 2014, gaining over 60%, only to drop another 67% into the infamous January 2015 low. That rally and drop were enough to create positive divergences (lower prices but strengthening technical indicators) to kick in the ~10,000% rally.
Bottom Line
Past performance is, of course, no guarantee for future results, but it would not be unexpected to see a similar path take shape now as well. It will require a break above $23K to suggest this is the case, but BTC will have to stay below $35K to keep considering it a counter-trend rally. Meanwhile, positive divergences are also developing (green dotted arrows), but the price of BTC has yet to react to it.
This article was originally posted on FX Empire