Prometheus monitoring system: all you need to know
Prometheus seeks to be a new generation within open source monitoring tools. A different approach with no legacies from the past.
For years, many monitoring tools have been linked to Nagios for its architecture and philosophy or just for being a total fork (CheckMk, Centreon, OpsView, Icinga, Naemon, Shinken, Vigilo NMS, NetXMS, OP5 and others).
Prometheus software however, is true to the “Open” spirit: if you want to use it, you will have to put together several different parts.Somehow, like Nagios, we can say that it is a kind of monitoring Ikea: you will be able to do many things with it, but you will need to put the pieces together yourself and devote lots of time to it.
Mục lục bài viết
Prometheus monitoring architecture
Prometheus, written in the go programming language, has an architecture based on the integration of third-party free technologies:

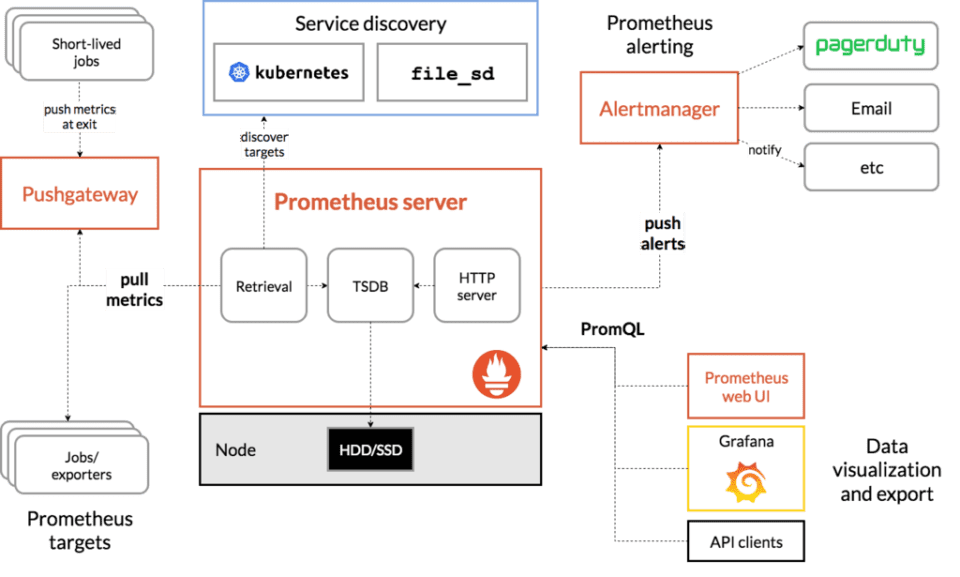
Unlike other well-known systems, which also have many plugins and parts to present maps, Prometheus needs third parties to, for example, display data (Grafana) or execute notifications (Pagerduty).
All those high-level elements can be replaced by other pieces, but Prometheus is part of an ecosystem, not a single tool. That’s why it has exporters and key pieces that in the background are other Opensource projects:
- HAProxy
- StatsD
- Graphite
- Grafana
- Pagerduty
- OpsGenie
- and we could go on and on.
Would you like to monitor your systems for free with one of the best monitoring software out there?
Pandora FMS, in its Open Source version, is free forever and for whatever number of devices you want.
Let us tell you all about it here:
Prometheus and data series
If you’re familiar with RRD, you guessed it right!
Prometheus is conceived as a framework for collecting data of undefined structure (key value), rather than as a monitoring tool. This allows you to define a syntax for your evaluation and thus store it only in case of a change event.
Prometheus does not store data in an SQL database.
Like Graphite, which does something similar, like other systems from another generation that store numerical series in RRD files, Prometheus stores each data series in a special file.
If you are looking for a Time series database information gathering tool, you should take a look at OpenTSBD, InfluxDB or Graphite.
What to use Prometheus for
Or rather, what to NOT use Prometheus for.
They themselves say it on their website: if you are going to use this tool to collect logs, DO NOT DO it, they propose ELK instead.
If you want to use Prometheus to monitor applications, servers or remote computers using SNMP, you may do so and generate beautiful graphics with Grafana, but before that…
Prometheus settings
All the configuration of the Prometheus software is done in YAML text files, with a rather complex syntax. In addition, each employed exporter has its own independent configuration file.
In the event of a configuration change, you will need to restart the service to make sure it takes the changes.
Reports in Prometheus
By default, Prometheus monitoring has no report type.
You will have to program them yourself using their API to retrieve data.
Of course, there are some independent projects to achieve this.
Dashboards and visual displays
To have a dashboard in Prometheus, you’ll need to integrate it with Grafana.
There is documentation on how to do this, as Grafana and Prometheus coexist amicably.
Scalability in Prometheus
If you need to process more data sources in Prometheus, you may always add more servers.
Each server processes its own workload, because each Prometheus server is independent and can work even if its peers fail.
Of course, you will have to “divide” the servers by functional areas to be able to differentiate them, e.g.: “service A, service B”. So that each server is independent.
It does not seem like a way to “scale” as we understand it, since there is no way to synchronize, recover data and it does not have high availability or a common access framework to information on different independent servers.
But as we warned at the beginning, this is not a “closed” solution but a framework for designing your own final solution.
Of course, there is no doubt that Prometheus is able to absorb a lot of information, following another order of magnitude than other better known tools.
Monitoring systems with Prometheus: exporters and collectors
Somehow, each different “way” of obtaining information with this tool, needs a piece of software that they call “exporter”.
It is still a binary with its own YAML configuration file that must be managed independently (with its own daemon, configuration file, etc.).
It would be the equivalent of a “plugin” in Nagios.
So, for example, Prometheus has exporters for SNMP (snmp_exporter), log monitoring (grok_exporter), and so on.
Example of configuring a snmp exporter as a service:

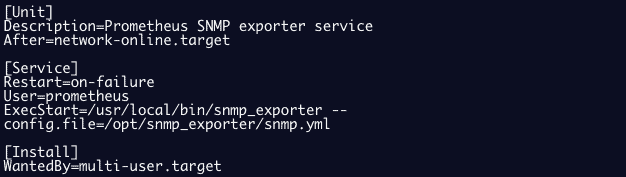 Prometheus monitoring exporter SNMP
To get information from a host, you may install a “node_exporter” that works as a conventional agent, similar to those of Nagios.
These “node_exporters” collect metrics of different types, in what they call “collectors”.
By default, Prometheus has activated dozens of these collectors. You can check them all by going to Annex 1: active collectors.
And, in addition, there are multiple “exporters” or plugins, to obtain information from different hardware and software systems.
Although the number of exporters is relevant (about 200), it does not reach the level of plugins available for Nagios (more than 2000).
Here is an example of an Oracle exporter.
Conclusion
Prometheus’ approach for modern monitoring is much more flexible than that of older tools. Thanks to its philosophy, you may integrate it into hybrid environments more easily.
However, you will miss reports, dashboards and a centralized configuration management system.
That is, an interface that allows seeing and monitoring grouped information in services / hosts.
Because Prometheus is a data processing ecosystem, not a common IT monitoring system.
Its power in data processing is far superior, but the use of that data for day-to-day use makes it extremely complex to manage, as it requires many configuration files, many external commands distributed and everything must be maintained manually.
Annex 1: Active collectors in Prometheus
Here are the collectors that Prometheus has active by default:
These “node_exporter” collect metrics of different types, in what they call “collectors”, these are the serial collectors that are activated:
arpExposes ARP statistics from /proc/net/arp.bcacheExposes bcache statistics from /sys/fs/bcache/.bondingExposes the number of configured and active slaves of Linux bonding interfaces.btrfsExposes btrfs statisticsboottimeExposes system boot time derived from the kern.boottime sysctl.conntrackShows conntrack statistics (does nothing if no /proc/sys/net/netfilter/ present).cpuExposes CPU statisticscpufreqExposes CPU frequency statisticsdiskstatsExposes disk I/O statistics.dmiExpose Desktop Management Interface (DMI) info from /sys/class/dmi/id/edacExposes error detection and correction statistics.entropyExposes available entropy.execExposes execution statistics.fibrechannelExposes fibre channel information and statistics from /sys/class/fc_host/.filefdExposes file descriptor statistics from /proc/sys/fs/file-nr.filesystemExposes filesystem statistics, such as disk space used.hwmonExpose hardware monitoring and sensor data from /sys/class/hwmon/.infinibandExposes network statistics specific to InfiniBand and Intel OmniPath configurations.ipvsExposes IPVS status from /proc/net/ip_vs and stats from /proc/net/ip_vs_stats.loadavgExposes load average.mdadmExposes statistics about devices in /proc/mdstat (does nothing if no /proc/mdstat present).meminfoExposes memory statistics.netclassExposes network interface info from /sys/class/net/netdevExposes network interface statistics such as bytes transferred.netstatExposes network statistics from /proc/net/netstat. This is the same information as netstat -s.nfsExposes NFS client statistics from /proc/net/rpc/nfs. This is the same information as nfsstat -c.nfsdExposes NFS kernel server statistics from /proc/net/rpc/nfsd. This is the same information as nfsstat -s.nvmeExposes NVMe info from /sys/class/nvme/osExpose OS release info from /etc/os-release or /usr/lib/os-releasepowersupplyclassExposes Power Supply statistics from /sys/class/power_supplypressureExposes pressure stall statistics from /proc/pressure/.raplExposes various statistics from /sys/class/powercap.schedstatExposes task scheduler statistics from /proc/schedstat.sockstatExposes various statistics from /proc/net/sockstat.softnetExposes statistics from /proc/net/softnet_stat.statExposes various statistics from /proc/stat. This includes boot time, forks and interrupts.tapestatsExposes statistics from /sys/class/scsi_tape.textfileExposes statistics read from local disk. The –collector.textfile.directory flag must be set.thermalExposes thermal statistics like pmset -g therm.thermal_zoneExposes thermal zone & cooling device statistics from /sys/class/thermal.timeExposes the current system time.timexExposes selected adjtimex(2) system call stats.udp_queuesExposes UDP total lengths of the rx_queue and tx_queue from /proc/net/udp and /proc/net/udp6.unameExposes system information as provided by the uname system call.vmstatExposes statistics from /proc/vmstat.xfsExposes XFS runtime statistics.zfsExposes ZFS performance statistics.Active collectors by default in Prometheus
Annex 2: Oracle exporter example
This is an example of the type of information that an Oracle exporter returns, which is invoked by configuring a file and a set of environment variables that define credentials and SID:
- oracledb_exporter_last_scrape_duration_seconds
- oracledb_exporter_last_scrape_error
- oracledb_exporter_scrapes_total
- oracledb_up
- oracledb_activity_execute_count
- oracledb_activity_parse_count_total
- oracledb_activity_user_commits
- oracledb_activity_user_rollbacks
- oracledb_sessions_activity
- oracledb_wait_time_application
- oracledb_wait_time_commit
- oracledb_wait_time_concurrency
- oracledb_wait_time_configuration
- oracledb_wait_time_network
- oracledb_wait_time_other
- oracledb_wait_time_scheduler
- oracledb_wait_time_system_io
- oracledb_wait_time_user_io
- oracledb_tablespace_bytes
- oracledb_tablespace_max_bytes
- oracledb_tablespace_free
- oracledb_tablespace_used_percent
- oracledb_process_count
- oracledb_resource_current_utilization
- oracledb_resource_limit_value
To get an idea of how an exporter is configured, let’s look at an example, with an JMX exporter configuration file:
startDelaySeconds: 0
hostPort: 127.0.0.1:1234
username:
password:
jmxUrl: service:jmx:rmi:///jndi/rmi://127.0.0.1:1234/jmxrmi
ssl: false
lowercaseOutputName: false
lowercaseOutputLabelNames: false
whitelistObjectNames: ["org.apache.cassandra.metrics:*"]
blacklistObjectNames: ["org.apache.cassandra.metrics:type=ColumnFamily,*"]
rules:
  - pattern: 'org.apache.cassandra.metrics<type=(\w+), name=(\w+)><>Value: (\d+)'
    name: cassandra_$1_$2
    value: $3
    valueFactor: 0.001
    labels: {}
    help: "Cassandra metric $1 $2"
    cache: false
    type: GAUGE
    attrNameSnakeCase: false
Consultor SEO y colaborador de Pandora FMS desde 2021. Revisa que la arquitectura de la información sea la más adecuada para que Pandora llegue hasta todos los que necesitan utilizar su solución de monitorización flexible. Y es un corrector inflexible.
SEO consultant and Pandora FMS collaborator since 2021. Checks that the information architecture is the most appropriate for Pandora to reach everyone who needs to use its flexible monitoring solution. Yes it is an inflexible corrector.
converseo.agency/