Bitcoin: Bear Market In The Rearview Mirror Or Initial Decline? (BTC-USD)

Olemedia
As Bitcoin (BTC-USD) emerges from its second-worst year in its 14-year history, it’s worth looking back to see some of the challenges the first and largest cryptocurrency has overcome. And, despite tremendous volatility along the way, Bitcoin has shown incredible resilience and has a setup for prospective big gains in the next 18 months.
– 2014 had the Mt. Gox hack, in which the exchange lost several hundred thousand Bitcoin.
– 2018 was Bitcoin’s largest annual loss, at -73%.
– 2022 came with the Terra Luna crash, the Celsius crash, and the FTX collapse.
Additionally, Bitcoin has weathered several rounds of various regulations, including some outright bans by various countries. Nevertheless, here we are in 2023 and price is up 70% year-to-date (as of writing this article), and up 81% from the November low.
Given the “events” of 2022, there have been concerns surrounding the Terra, Celsius, and FTX failures, but Bitcoin has managed to survive and maintain its position as the leading digital currency. While these failures have demonstrated some of the risks of the larger crypto space, what’s also apparent is Bitcoin’s strength and stability in the face of adversity.
Lastly, though speculative as to how much of an effect this may have on the price of Bitcoin in the near term, a growing number of investors shaken by recent bank liquidity issues are taking note of the self-custody prospect available to holders of Bitcoin.
In my last Seeking Alpha Bitcoin article from early 2022, the takeaway was for Bitcoin to be working on forming a lasting bottom in 2022, with a forecast favoring that $24k would contain any selling. The latter part of that forecast was proven incorrect in June of last year, when the price broke key support. From the article, the question (and answer was posed):
“What if $24k doesn’t hold?
Though this is not expected, it has become important to provide coverage of this prospect, given Bitcoin’s detour to the least bullish of our previous expectations.
First, a break below $24k does not constitute an invalidation of the primary Elliott Wave pattern that has price nearing a bottom in wave 4 of (3). A brief spike through $24k would not compromise the larger pattern, so long as price quickly and resoundingly recovers. However, a sustained break below $24k has strong ramifications for the longer term forecasts. Such a prospect would “downshift” our expectations to an ending diagonal pattern originating from the December 2018 lows.”
Though the recent developments of the latter half of 2022 have reduced my overall confidence in reaching $100k prior to a more protracted bear market (more than has already occurred), I remain cautiously bullish in the medium term.
Let’s take an Elliott Wave view of the current pattern to help glean nearer-term expectations for Bitcoin, as well as key supports needed to maintain a shorter-term bullish view and resistances that need to be surpassed to shake off reasonable medium-term bearish prospects.
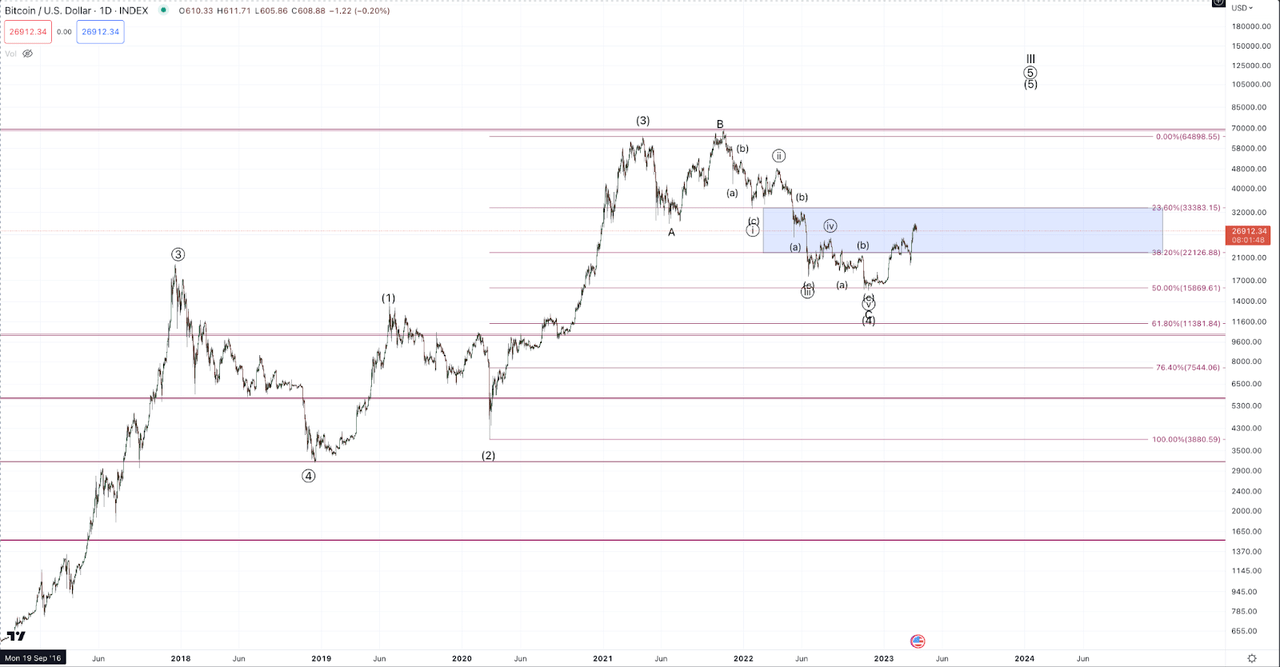
First, considering the pattern from the 2018 low, Bitcoin has formed an upward trending 3 wave.
Rally, labeled (1)-(2)-(3).

Jason Appel (Crypto Waves)
In Elliott Wave, we observe that typically, in strong trends, the price will form a 5 wave rally, ideally as an “impulse.” A simple description of an impulse is a five wave trending pattern that develops with an initial microdegree five wave rally and subsequent three wave pullback or consolidation, referred to as waves 1 and 2, followed by a larger breakout with strong unidirectional price action in a micro five waves, wave 3, followed by a consolidation of that breakout, wave 4. Following the completion of wave 3, the wave 4 consolidation cannot overlap into the price action of wave 1. Finally, assuming the price holds necessary support for a wave 4 the final wave up, which should minimally make new highs exceeding the wave 3 high and maximally, in the case of blowoff tops, rise epically above the wave 3 high in climactic fashion.
Coming back to the Bitcoin chart: Price has formed what appears to be a potentially impulsive pattern, with 3 complete waves from the 2018 low into the 2021 highs. As such, our expectations have been for Bitcoin to rise considerably in its 5th wave, provided wave 4 support holds. The “standard” support range for wave 4 in an impulse is the 38.2%-23.6% retrace of the third wave. In terms of price, this support region was $22.1k- $33.4k. In addition to these levels, we consider other key Fibonacci relationships among the various subwaves and look for confluence in levels. $24k was an area of particular confluence. Also, after the initial drop of the wave (4) into the June 2021 lows held the 23.6% retrace for all intents and purposes, followed by price slightly breaching the April 2021 highs expectations were for a test of the lower end of the standard support region, that would ideally provide a successful test of $24k to form a wave (4) bottom. Though it’s valid to consider the drop into the June 2021 low all of (4) and the higher high in November all of (5) the was too abbreviated and anemic to consider it the 5th wave as the most likely interpretation.
As noted previously, $24k did not hold. Often when the 38.2% retrace is resoundingly broken, it’s an early signal of concern that price will not follow through on impulsive expectations. The next key support below is the 50% retrace of the wave (3). When price retraces 50% of the wave (3), it’s not an invalidation of the larger impulsive expectations but any meaningful or sustained break below the 50% tips odds away from continuing to favor impulsive upside continuation.
The 50% retrace, in logarithmic scale, measured from the March 2020 low to the April 2021 high (the length of wave (3)) was $15,869. This level is not to be considered a hard invalidation point. Rather, it’s a pivot of sorts. The longer and deeper that price moved beneath it, the more likely it is that the impulse would fail. Though Bitcoin did break below a few times, the breaks were very minimal in terms of price and time. And based on the subsequent activity since the November low, we can say that, for all intents and purposes, the 50% retrace has held.
To recap, Bitcoin has 3 up from the 2018 low, and the 2022 decline, amidst the Terra and Celsius crashes, and the revelations of fraud and quick collapse of FTX, took the price right to the acceptable edge of support for a 4th wave. In one sense, it’s remarkable that Bitcoin has maintained its bullish setup amidst all of the bearish developments. In another, it has heightened concerns about the thesis that BTC will reach in excess of $100k in the current longer-term cycle from the 2018 lows.
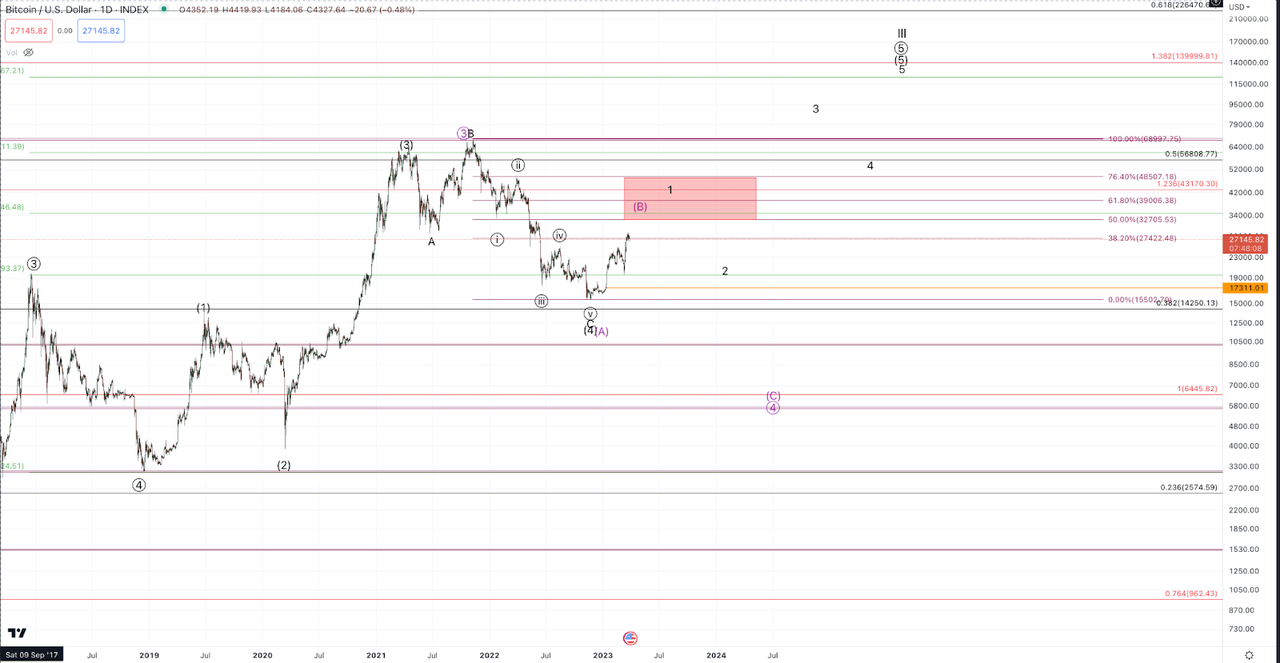
In the recent activity since the November low, we must note that price has formed what counts best as a micro 5 waves up into the Mid-February high, followed by a quick test of Fibonacci support into the mid-March low, followed by an immediate micro 5 up, exceeding the February high and the August high, a key downside resistance that effectively breaks the downtrend.
With all that’s transpired, though I can’t rule out a lower low (which will be discussed), the primary interpretation of this action from November is an initiation move of sorts. In the accompanying chart (immediately below), this favors the black count.

Jason Appel (Crypto Waves)
The alternative perspective shown in the purple count suggests that the rally from the November low is a corrective – rather than an initiating – move to start a pattern up to new all-time highs. In this case, Fibonacci resistance as evaluated from the retrace of the move down from the wave (3) high down to the November 2022 low is $32.5k-$48.5k. Ultimately, BTC will need to resoundingly exceed this region to “prove” itself. And even though BTC has not yet reached this region, it is doing everything necessary to make a test of resistance quite likely.
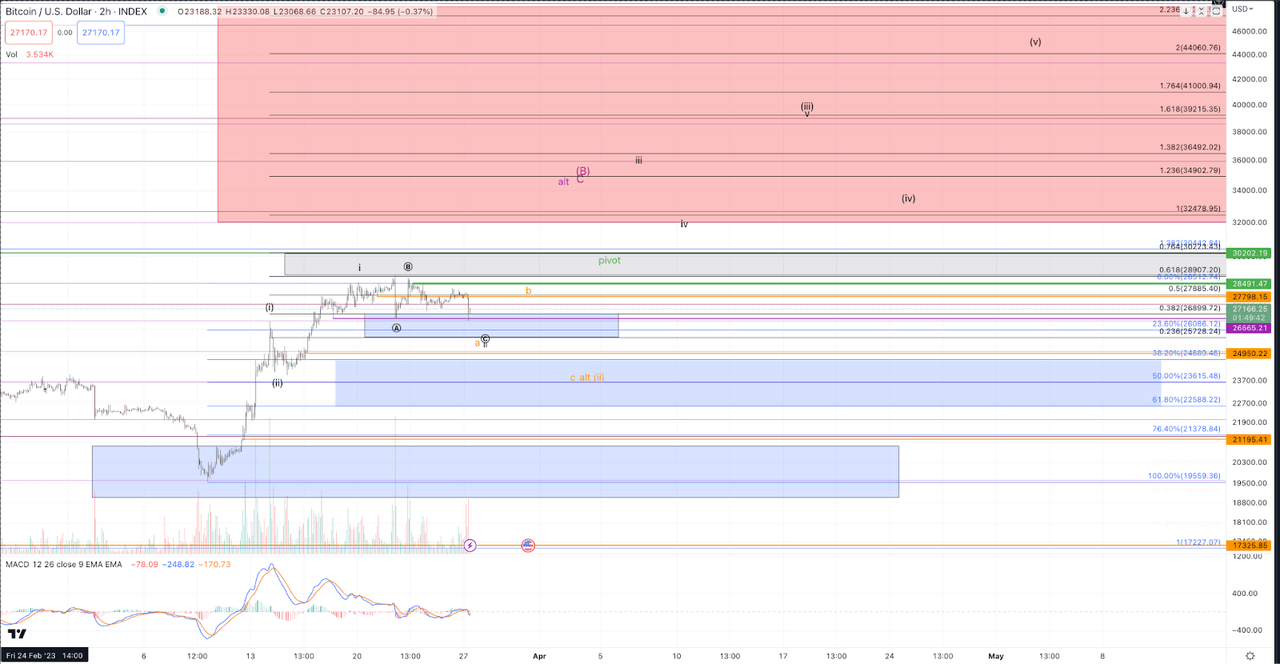
On a smaller degree (see chart immediately below), BTC has what counts best as a very bullish (i)-(ii), i-ii setup from the March 2023 low. This portends a big breakout once BTC breaks above this past week’s high. The minimal target for this micro breakout is the $32.5k region, though $35k+ is preferred. Once BTC breaks above $32k, holding above this week’s high becomes necessary for us to maintain a reasonable bullish bias. And, if alternatively, the price should break out and then come back strongly through $28.9k, it will shift odds in favor of the bearish purple count in which the price can be topping in a corrective move, setting up another decline to sub $10k levels.

Jason Appel (Crypto Waves)
In the favored black count, the preferred path for BTC over the coming weeks is a series of breakouts and consolidations over support to ultimately take the price upwards of $40k before the next key inflection point.
Prior to the expected breakout, the two key support areas are $25.7k-$26.9k, and below $25k, the lower support region for the expected breakout to $32k+ is $22.5k-$24.7k. Right now, based on the consolidation just beneath last week’s high, the upper support region is favored to hold. That said, should this week begin with some selling pressure, a test of lower support is quite fine for the current setup so long as $21k is holding. Below there, strongly reduces odds of any immediate upside continuation.
On a sentimental note, the type of disinterest that’s pervasive throughout the market is typical for this early stage of a larger 5th wave. We’ve seen this numerous times in Elliott Wave study across different markets. Will it be different this time? Is the herd correct to have lost interest in BTC for the next few years? Possibly. But given the guidelines and parameters that this technical approach provides us, I’m keen on playing the long side given the phenomenal implied risk-to-reward skew offered in the current stance. My larger degree target for BTC to complete this 5th wave is $108k-$140k.


