Bitcoin Halving History: Charts & Dates | Coinmama Blog
The next Bitcoin halving will soon be upon us, and many people expect it to have a positive effect on the Bitcoin price. The third such event in Bitcoin’s history, it’s projected to occur in mid-May of this year.
If you’re unsure how halvings work or why they’re significant, you may also be wondering why they’re relevant to price. In this article, we’ll explain what a Bitcoin halving is, and will look at its historical price impact.

Mục lục bài viết
What is a Bitcoin Halving?
For every block a miner adds to the blockchain, he or she is rewarded with a certain amount of newly-created Bitcoin. Yet there is also a finite number of Bitcoins that can ever be created. In order to extend the life of Bitcoin and ensure that it remains a deflationary asset, Satoshi Nakamoto wrote into Bitcoin’s code that the supply of new BTC awarded to miners is halved every 210,000 blocks, or roughly every 4 years. For this reason, Bitcoin halvings serve as major milestones in Bitcoin’s timeline, dividing it into distinct periods.
But why does this affect the price? Just as multiplying the available supply of fiat currency has dramatic knock-on effects for a country’s economy, most notably rampant inflation, halving the supply of bitcoin is a major economic change with wide-reaching consequences. Increasing supply has the effect of making fiat money less scarce, thus reducing its value—that’s why prices rise rapidly when inflation is high. Decreasing bitcoin supply increases scarcity, which historically has led to a higher value.
When was the last Bitcoin Halving?
The last Bitcoin Halving took place on July 9th, 2016 which caused the block reward to fall from 25 new Bitcoin created to 12.5 new Bitcoin created. As to be expected, there were large fluctuations in the Bitcoin in the months surrounding this event.
Bitcoin Halving Chart with Dates
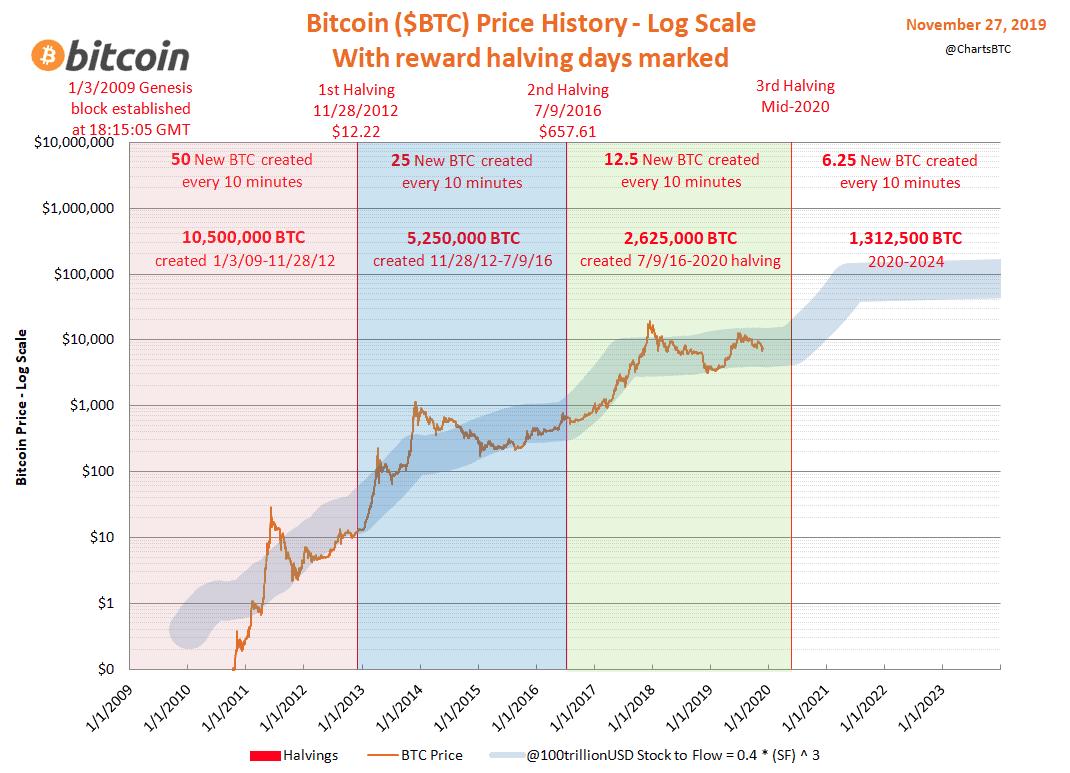
One of the best ways to gauge what effect the new halving will have on price is to look at a price chart with all previous halvings demarcated:

Courtesy of @ChartsBTC on Twitter, this logarithmic chart shows Bitcoin’s price against halvings.
Let’s examine this chart in depth, as it helps to clarify the price effect of previous halvings. We’ll examine each of Bitcoin’s 4 “ages” in turn, starting from the reddish block on the left.
1) Pre-Halving Era
Time Span: January 9th 2009 to November 28th, 2012.
Block Span: 0 to 210,000.
Block Reward: 50 BTC per block mined.
The leftmost block represents Bitcoin’s earliest period, during which time it was largely unknown to the general public. Satoshi set the initial block reward at 50 BTC. Thus, for every block a miner added to the chain, they both earned and created 50 BTC. The result of this high reward was rapid early issuance, with 50% of Bitcoin’s entire total supply (of 21 million BTC) issued during this initial period.
Satoshi personally acquired a large chunk, as he was practically the only miner throughout much of 2009. Outside of technical curiosity, there was little incentive to participate in early mining, as BTC had yet to establish any real value. Only in late 2010, with the emergence of early exchanges, was a price point above $1 established. This demonstration of value soon attracted more miners, ramping up difficulty and driving competition for ever-faster mining hardware and cheaper power.
As awareness of this new technology’s potential began to spread, a credible market value was gradually established, and early adopters realized that Bitcoin had the potential to achieve tremendous growth in the future.
Bitcoin’s abundant early supply was thus soaked up by those with foresight. This led to Bitcoin’s first price spike above $10, as sellers noticed the demand and began demanding a higher price for their coins. A crash followed but recovery was rapid, as the market realized that the halving in late 2012 would offer price support. The pattern of a rising price leading to a halving was established at the end of this era.
2) 1st Halving Era
Time Span: November 28th, 2012 to July 9th, 2016.
Block Span: 210,000 to 420,000.
Block Reward: 25 BTC per block mined.
As 50% of BTC supply was issued during the earliest era, it’s logical that 75% of supply had been issued by the end of this phase. The economic model of supply and demand has it that if supply decreases while demand holds steady or increases, prices must rise. This was proven nicely during Bitcoin’s 2nd era, as the price rose dramatically.
As predicted, decreased supply (and expanding public awareness) led to a higher Bitcoin price during this era. Price peaked explosively above $1,000 in late 2013 before crashing as the leading exchange at the time, Mt. Gox, failed catastrophically. This led to an extended period of decline and stabilization. Significantly, price held above the previous era’s peak, maintaining a bullish chart from a long term perspective.
It’s likely that the prospect of the 2016 halving motivated to resume its upward trend.
3) 2nd Halving Era
Time Span: July 9th, 2016 to mid-May 2020 (estimated).
Block Span: 420,000 to 630,000.
Block Reward: 12.5 BTC per block mined.
We arrive now at our current era. By around May of this year, a little over 89% of all Bitcoin will be issued.
One difference to notice from previous eras is that the usual pattern of a steady price rise about a year out from the halving has yet to occur. A possible reason for this is the fallout from the massive PlusToken ponzi scam in China. The fraudsters accumulated a massive $2 billion worth of Bitcoin which, according to blockchain analysis experts, is still being sold off. This major selling volume is reportedly suppressing the price of Bitcoin.
Nevertheless, many people predict that barring any major shake-ups in the current crypto ecosystem, once the next halving occurs, Bitcoin’s price will have to rise due to diminished supply.
Bitcoin stock to flow model
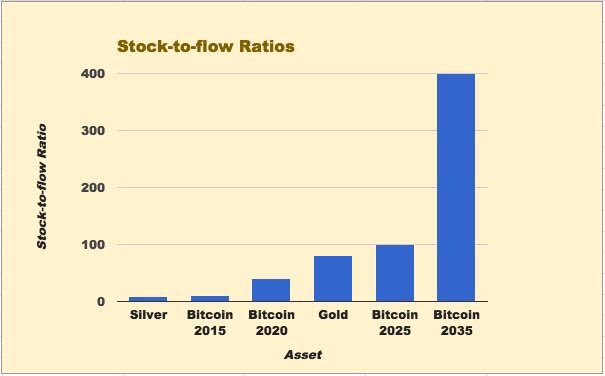
In addition to supply and demand considerations, there’s another popular economic model that has relevance to any discussion of the halving. The Stock-to-Flow Model has recently gained popularity as a means of projecting Bitcoin’s price. This model tracks the ratio between existing supply (stock) and the rate of new issuance (flow). This is essentially another way to measure scarcity.

From Jim Brysland; a comparison of Bitcoin’s Stock to Flow ratio against monetary metals.
The model shows that sometime before 2025, Bitcoin will overtake gold in terms of scarcity value, thus potentially becoming a better store of value than the yellow metal. The increasing ratio is directly related to the reduction of “flow” through the halving mechanism.
Bitcoin Halving 2020
It’s impossible to predict how much Bitcoin’s price will rise during the next halving age, or even that it will rise at all! However, previous ages have seen major peak-to-peak increases:
-
From the pre-halving to 1
st
halving era, we saw a 37 times increase ($31.50 to $1178).
-
From the 2
nd
to 3
rd
halving eras, we saw a 16 times increase ($1178 to $19800).
While this is far from enough data for any meaningful projections, if the above pattern continues we might see a 7 fold price increase during the upcoming 4th halving era, which would take price into the $138,600 range. This is pure speculation however and certainly should not be construed as investment advice.
The next Bitcoin Halving
The next Bitcoin Halving is expected to occur in early to mid-May, 2020, though the exact date is still unknown. To track exactly when the next Bitcoin halving will occur, check out TheHalvening.com site. The closer to the actual event, the more accurate its estimate will be.
Empowering the world to exchange cryptocurrency. With Coinmama, you can buy, sell and trade cryptocurrency hassle-free.


