
Crypto trading strategies with Bollinger Bands
Mục lục bài viết
How To Use Bollinger Bands in Your Trading
As we said above, Bollinger bands can provide reversal as well as continuation signals. The following strategies take advantage of this bands feature.
1) Bollinger Bounce
This is, by far, the most simple strategy to trade cryptocurrencies using Bollinger bands. Considering that the lower band provides oversold levels and the upper band overbought ones, just buy when the market is near the lower band, or below it, and sell when the market price is near or above the upper bands. Easy, huh?
Not so fast! Before trading the Bollinger bounce you have to identify the current market conditions. Is the price moving sideways or is it trending? In the first case, this strategy will work like a charm, but in the second one, be prepared to lose a lot of money.
Fortunately, Bollinger bands provide a criterion to say when the market is in a trendless mode: if the bands are almost flat, then it’s time to trade the Bollinger bounce strategy.
Let’s go through an example: look at the following LTCUSD 4-hours chart. The green circles signal potential buy opportunities while the red circles are the right place to sell.
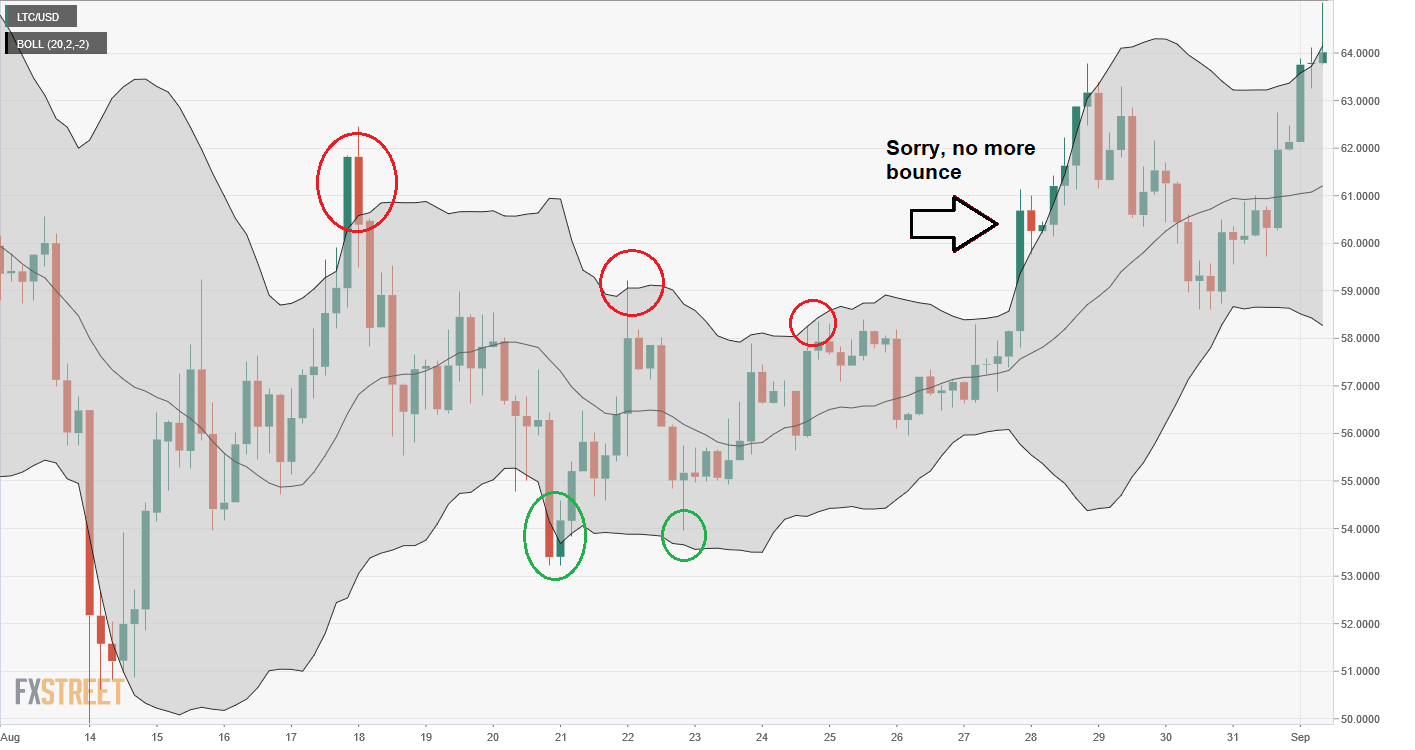
While the Bollinger bands slope is flat, the bounce strategy works nicely but, what happens when the price breaks above the upper band and doesn’t come back? Then it’s time to stop trading the Bollinger bounce. Of course, when trading this strategy it’s important to set stop loss levels not very far from our entry point.
2) Bollinger Squeeze
Bollinger bands also provide a way to detect the start of new trends. Just look for an extended low volatility period, with narrowing bands, and wait for a candle closing above or below the bands as they start to expand. Once you identify this pattern, just trade in the direction of the breakout.
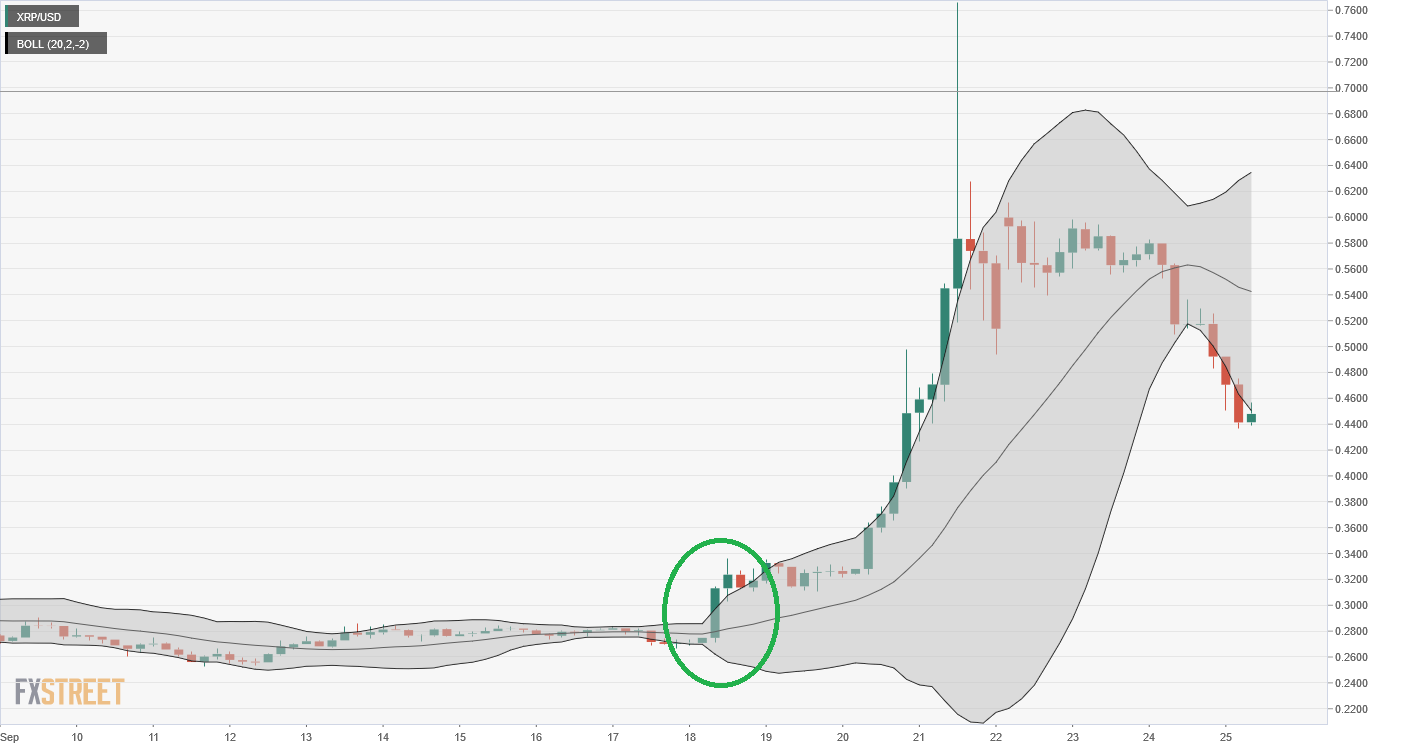
A clear example of a Bollinger squeeze can be found in the following Ripple 4 hours chart: after several days of low volatility market, there’s a strong bullish candle breaking above the upper band (green circle). After the breakout, the XRPUSD initiated an explosive upward movement, gaining more than 100%, showing several new highs above the upper band.
Conclusion
Bollinger bands are a great tool to understand how market volatility fluctuates and find excellent trading opportunities. However, it is important not to forget that the interpretation of Bollinger bands is different depending on the current volatility regime. Therefore, never use them only as an overbought/oversold oscillator.
It is also advisable not to rely exclusively on a single indicator. It is better to combine Bollinger bands with other indicators such as RSI or ADX to identify entry and exit points. By doing this, you will be increasing your probability of success in trading.


