How to Use Candlesticks When Trading Cryptocurrency
In cryptocurrency trading, candlesticks show price action. They tell you what happened to the price of an asset in a given time frame.
Candlesticks also have underlying psychological implications and can be used with other indicators to improve your crypto trading strategy. In this article, we’ll get back to basics and explore the composition of candlesticks.
The Anatomy of a Candlestick
When you look at a trading chart on Liquid, you have a few options for how the price action is displayed, including:
- Traditional candles
- Hollow candles
- Heikin Ashi candles
- Bars
- Line graphs
“Traditional candles” is by far the most popular option on Liquid.

Individual candlesticks are composed of three key parts:
- Body (the main part of the candlestick)
- Lower shadow (the thin line, or wick, at the bottom)
- Upper shadow (the thin line, or wick, at the top)
Within these three sections, there are four price points to pay attention to:
- Open
- High
- Low
- Close
This is also known as an asset’s OHLC.
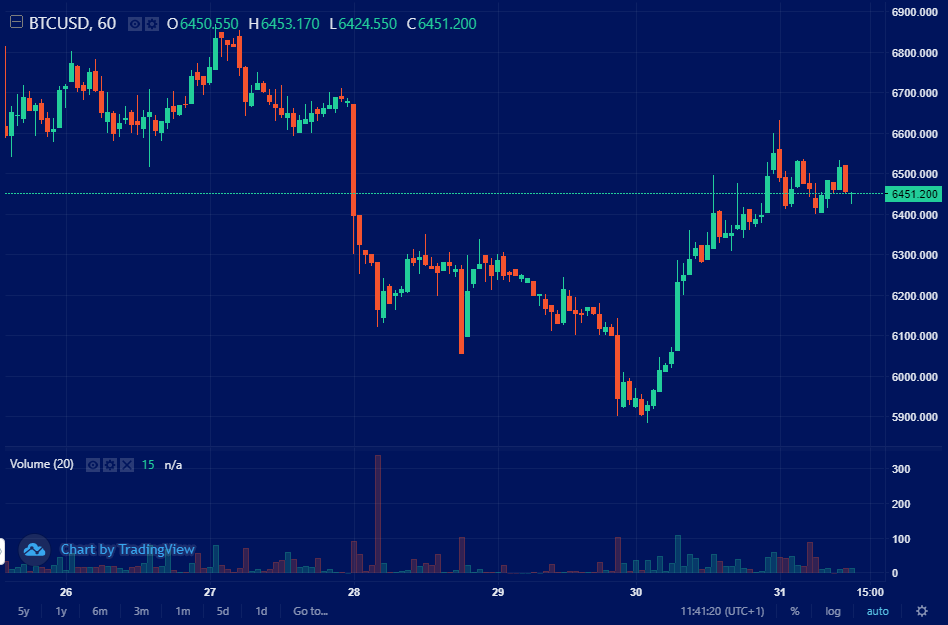
If you superimpose a candlestick on an XY-axis, the X-axis represents time while the Y-axis represents price.
A candlestick’s unit of time is equivalent to the timeframe that you set on Liquid’s trading interface. In the chart above, the timeframe is set to 1 hour, which means each candlestick displays one hour of price action.
What is a bullish candlestick?
By default, a bullish candlestick is green on Liquid. It’s bullish because there’s strong positive price movement.
The point where the lower wick meets the body is the opening price, while the point where the upper wick meets the body is the closing price.
The top of of the upper wick is the high price, and the bottom of the lower wick is the low price.
See the diagram below.

What is a bearish candlestick?
A bearish candlestick is red. People are selling and the price has dropped.
The point where the lower wick meets the body is the closing price, while the point where the upper wick meets the body is the opening price.
The top of of the upper wick is the high price, and the bottom of the lower wick is the low price.
The story of a candlestick
While candlesticks may appear to be completely analytical in nature, they actually convey a complex story that is constantly evolving through contributions of market participants.
Observing an asset’s candlestick development over time enables you to form a deep understanding of its psychology.
The implications are profound.
Here are some scenarios that you might come across.
BTC/USD has risen 5% in the last hour. Should you change to a bullish bias?
A single hour of price action is usually not enough to change biases. If BTC/USD has risen 5% in the last hour, zoom out to a 4h or 1D timeframe to get the big picture.
If this one-hour move is contained within a bearish candle formation on larger timeframes, it’s probably not a good idea to flip biases until there is a reason to do so.
You’re sitting on a 15% gain on XRP/JPY now. Should you exit your position?
In a bullish move like a 15% gain on XRP/JPY, any sign of a bearish candlestick pattern would be a good place to exit a position either temporarily or permanently.
ETH/USD is in a freefall. When would be a good time to enter a long position?
When an asset is seemingly in freefall, “buying down” or “dollar cost averaging” can be a bad strategy for traders, especially those that who do margin trading.
In this scenario, it may be wise to wait for a high-volume bullish engulfing candle followed by a bullish candlestick pattern before entering a long position on ETH/USD.
Remember, catching a falling knife is dangerous for investors and deadly for traders.


