
Live Charts
+
Mục lục bài viết
1Y+ HODL Wave
1yr HODL Wave live chart shows the percentage of all bitcoins that have not been moved from one wallet to another for at least 1 year.
+
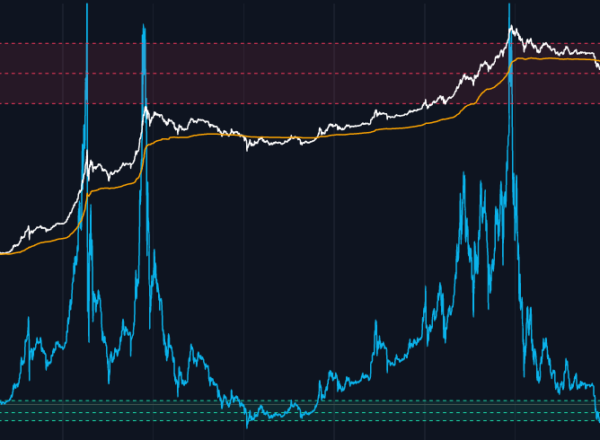
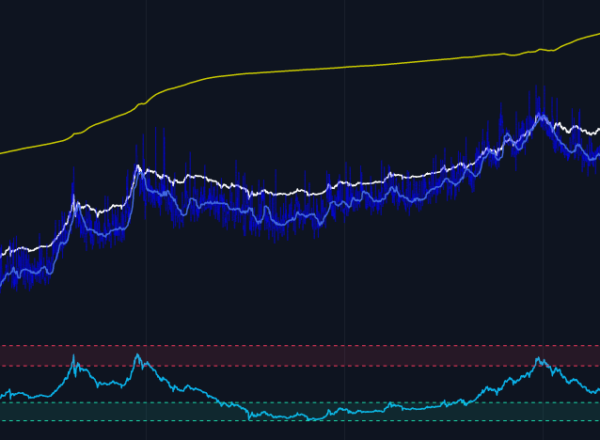
MVRV Z-Score
MVRV Z-Score uses a z-score standard deviation between market value and realised value (MVRV) to identify $BTC market tops and bottoms.
+
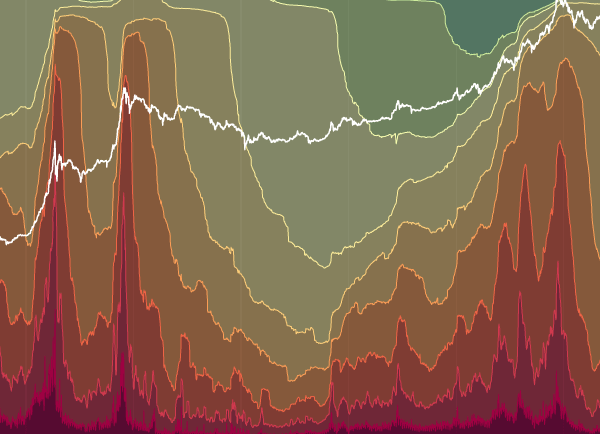
RHODL Waves
Live chart of HODL waves weighted by Realized value.
+
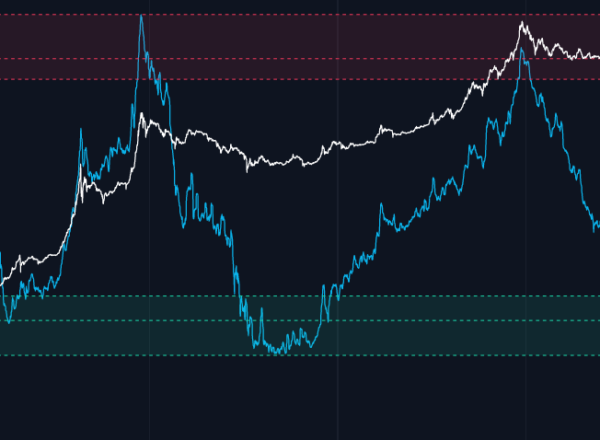
RHODL Ratio
RHODL Ratio looks at the ratio between RHODL band of 1 week versus the RHODL band of 1-2yrs to pick Bitcoin ($BTC) cycle tops to within a few days.
+
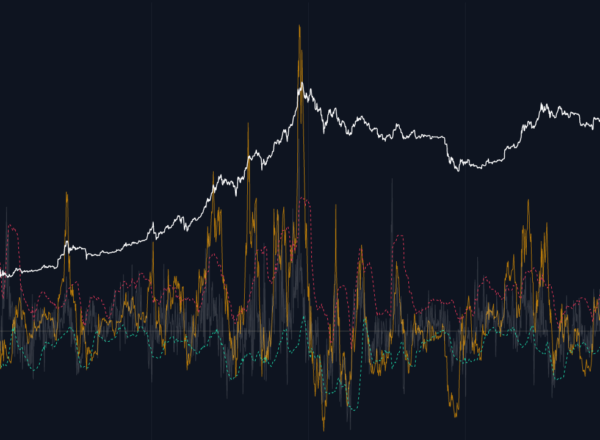
Advanced NVT Signal
Adaptation of NVT Signal using dynamic bands.
+
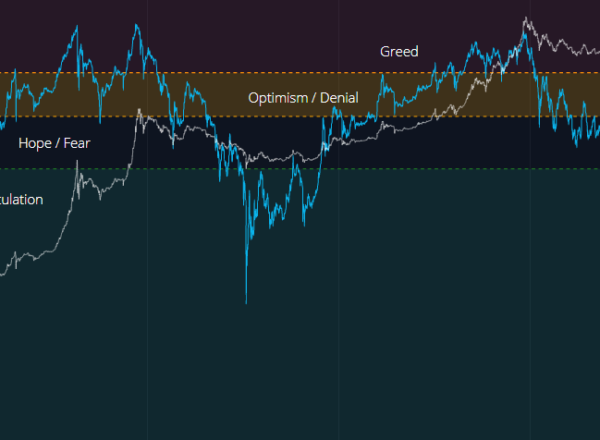
Relative Unrealized Profit/Loss
Relative Unrealized Profit/Loss is derived from market value and realised value to track investor sentiment over time for Bitcoin ($BTC).
+
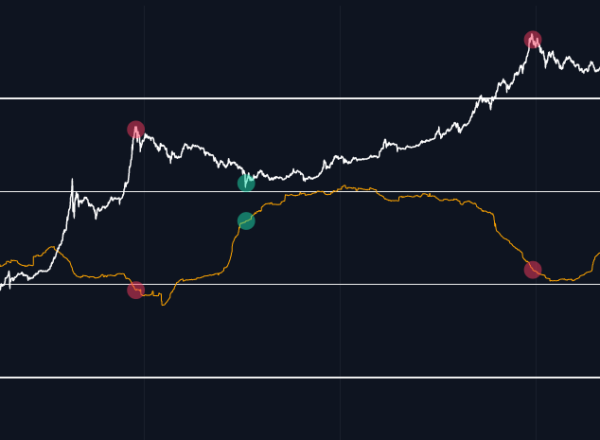
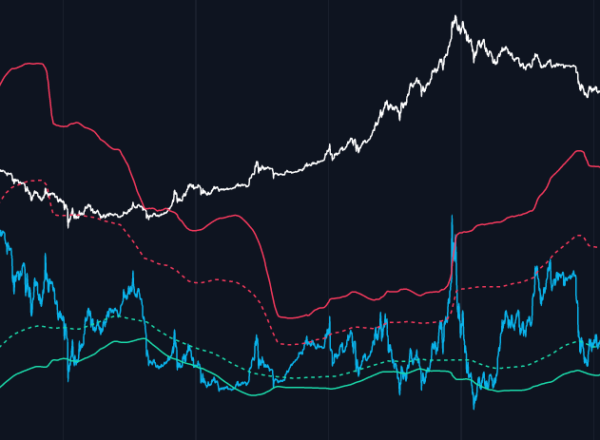
Reserve Risk
Reserve Risk live chart visualises the confidence amongst long term bitcoin holders relative to the price of Bitcoin at a given moment in time.
+
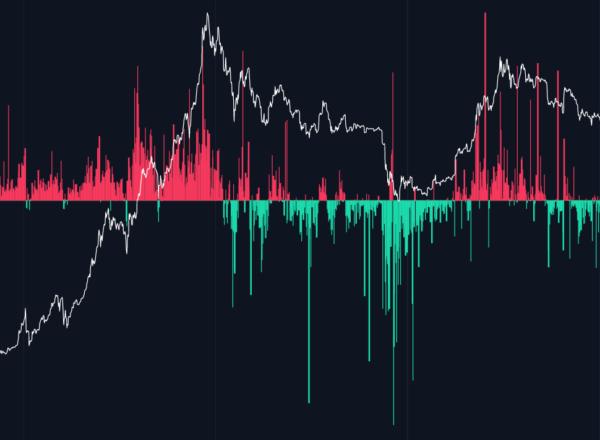
Active Addresses Sentiment Indicator
Experimental short term sentiment indicator for Bitcoin ($BTC) comparing the 28 day change in price (%) with the 28 day change in active addresses (%).
+
Spent Output Profit Ratio (SOPR)
Spent output profit ratio is a live chart that looks at whether Bitcoin wallets on chain are selling at a profit or a loss.
+
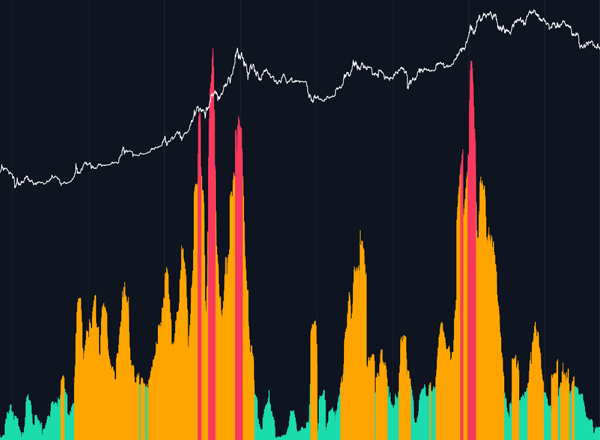
VDD Multiple
Value Days Destroyed (VDD) Multiple aims to identify when the price of Bitcoin may be becoming frothy and close to topping out at major cycle highs.


