Processing Grapher – chillibasket
Mục lục bài viết
Serial Monitor and Real-time Graphing Program
When prototyping with Arduino micro-controllers, serial messages sent with the Serial.println("text"); command are the most common way of debugging code and monitoring sensor values. While the Serial Monitor and Serial Plotter included with the Arduino IDE are fine for simple projects, there are several features missing which would be extremely useful for more complex projects. This motivated me to program my own serial message console program, which contains all the main features which I find important for my Arduino projects.
Processing Grapher is a serial monitor program which is meant to make it simple to analyse serial messages and sensor data in real-time, and to record that data to a file. I programmed it in “Processing”; this is a graphical library based on Java which makes it easy to draw and visualise data. The program is free to use and I have published all my code on GitHub, for anyone to play with and add their own features:
Main Features
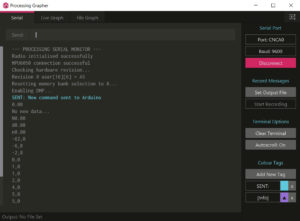
Serial terminal monitor
- You can connect to an Arduino, or any other serial device. Simply select the device from an auto-detected list and set the desired baud rate for the communication.
- Send and receive serial messages, identical to the Arduino Serial Monitor.
- Record all received messages to a text file.
- Change the colour of lines containing specific keywords, to highlight messages of interest.
Real-time Graphing
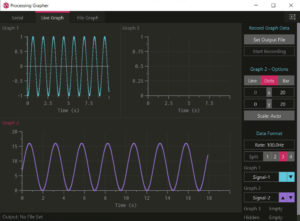
- Plot real-time data obtained from the serial device on a graph; this makes visualisation of live data easy!
- Plot multiple signals by sending several numbers separated with commas (for example:
12,24,-15.4) - Data can be displayed on up to 4 separate graphs, allowing you to isolate different signals.
- Apply different colours and names to each input signal.
- Record the real-time data as a comma separated values (CSV) file, which can then be opened in other data analysis programs such as Excel and MATLAB.
File Graphing
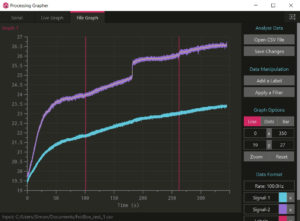
- Opens comma separated value (CSV) files for analysis; this allows you to look at the data you may previously have recorded with the program.
- You can zoom into different segments of the waveforms.
- Add vertical markers/labels to highlight important sections of the waveform.
- Apply filters to the signals, removing noise or processing the data.
- Save modified signals to a new file.
Installation/Setup Guide
Basic Usage in the Processing IDE
- Download and install the Processing IDE version 3.5.4 from https://processing.org/. Note that the newest version 4.0 is not supported yet.
- Clone or download all the program files from the GitHub repository.
- Open the main program file
ProcessingGrapher.pdein the Processing editor. All the other files should automatically open in separate tabs in the Processing IDE. - Press the
Runbutton in the top-left of the Processing editor to start the program.
Running the Program on Linux
To use the program on Linux, there are two additional steps that need to be taken:
- Change the renderer on line 217 to
final String activeRenderer = JAVA2D. Unfortunately the renderer used on the other platforms (JavaFX) currently has some compatibility issues on Linux. - If the error message
Permission Deniedappears when trying to connect to a serial port, this means that your current user account doesn’t have the permissions set up to access the serial ports. To solve you can either run the program usingsudo, or you can set up your user so that it has access to the ports using these two commands (replace<user>with the account username):sudo usermod -a -G dialout <user>sudo usermod -a -G tty <user>- Reboot the computer to apply the changes.
Creating a Stand-alone Program
It is possible to create a stand-alone version of the program, which does not require the Processing IDE to run.
- Open the sketch in the Processing IDE, as described in the previous steps.
- In the top bar, click on
File > Export Application... - In the Export Options window that pops up, select the platform you want to export for and make sure that the Embed Java option is ticked. Finally, click Export.
- This will create an application folder which will include either an
*.exefile (Windows), shell script (Linux) or*.applaunch file (OS X) which you can use to run the program. - When using or sharing this application, make sure to include all of the contents within the application folder since all the files are required to make it run.
- If you want to start the application without having to open up the application folder each time, create a shortcut. In Windows this can be done by right-clicking on the *.exe file and pressing
Create Shortcut.
Pre-compiled Stand-alone Program
If you don’t want to go through all of the steps above, I’ve also uploaded a zip-file containing Windows 64-bit the stand-alone program on GitHub. However, I am only updating these files for each major release/update of the program, so it may not contain the newest features and bug fixes. All other major operating systems are also supported (Mac OS X and Linux), but to create a stand-alone program you will need to export the application using the steps described above.
Instructions and User Guide
The “Serial” Monitor Tab
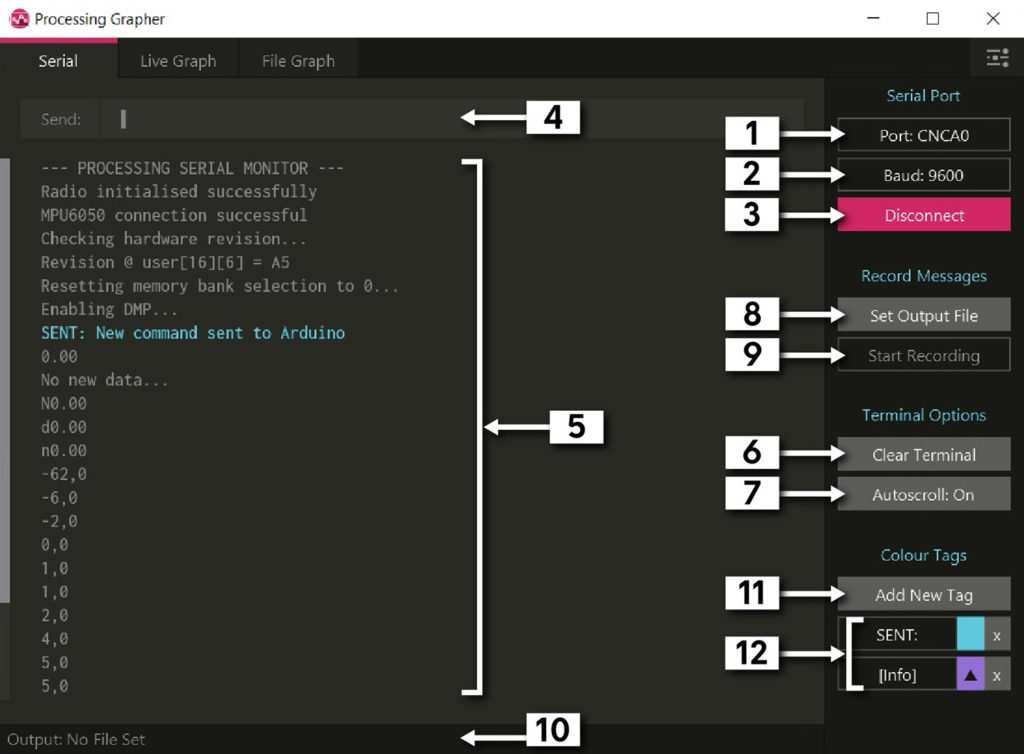 Figure 1: The “Serial Monitor” tab, with all the main functions labelled.
Connecting to a Serial Device
- Select the Port relating to the device you want to connect to. The port list will automatically update when new devices are plugged into the computer.
- Set the Baud rate for the serial communication. The most common rate used with Arduinos is 9600.
- Press the
Connect/Disconnectbutton to begin and end communication with the serial device. When disconnecting, make sure to hit the disconnect button before you unplug the device! Otherwise the serial port list won’t update properly anymore!
Terminal Console Area
- You can send a new message to the connected device by simply typing on the keyboard. Use the left and right arrow keys to edit different parts of the message. To send the message, press the enter/return key.
- The terminal console area displays all the sent and received serial messages.
- Press the
Clear Terminalbutton to remove all messages currently displayed in the terminal console. - The text displayed in the terminal console will automatically scroll down when new messages are received from the device. Press the
Autoscroll: On/Offbutton to enable or disable this scrolling.
Recording Received Messages to a file
- The program makes it easy to save all messages received from the serial device to a text file, where each message is saved on a new line. Press the
Set Output Filebutton to set where the recorded messages will be saved. - Press
Start/Stop Recordingbutton to start and end the serial message recording process. - The output file path where the recorded messages will be saved is shown in the bottom status bar.
Adding Colour Keyword Tags
The terminal console has a unique feature that it can change the colour of lines which contain specific text or keywords. If you receive a lot of serial messages, this can make it a lot easier to spot the important messages you a looking for.
- Press the
Add New Tagbutton to add a new colour keyword tag. A pop-up will appear where you can type the text you want to detect. - All the existing colour tags are listed at the bottom of the right-hand menu. You can click on the name of the tag to edit it. To delete the tag, click on the
xbutton. To swap the colours of two tags, press the^button.
The “Live Graph” Serial Plotting Tab
Message Format for Real-time Plotting
To plot real-time signals received from the serial device, the messages being received need to follow a specific format:
- Each message must contain the current values of all of the signals you want to plot, separated by commas.
- The message must end with the
New Line (\n)character. - The messages need to be sent at regular time-intervals.
- The message cannot contain any other characters which are not numbers or commas…
When listed like this it sounds confusing, but in practice it is actually very simple! For example, this would be the Arduino code used to plot the Analog Pin values 100 times a second:
// Variable used to run code at regular intervals
unsigned long updateTime = 0;

void setup () {
	// Open up the serial port
	Serial.begin(9600);
}

void loop () {
	// If it is time to check the sensors again
	// 10ms delay = frequency of 100Hz
	if (millis() - updateTime >= 10) {
		updateTime = millis();

		// Read the analog inputs
		int a0pin = analogRead(A0);
		int a1pin = analogRead(A1);
		int a2pin = analogRead(A2);

		// Send the values via serial
		Serial.print(a0pin);
		Serial.print(",");
		Serial.print(a1pin);
		Serial.print(",");
		Serial.println(a2pin);
	}
}
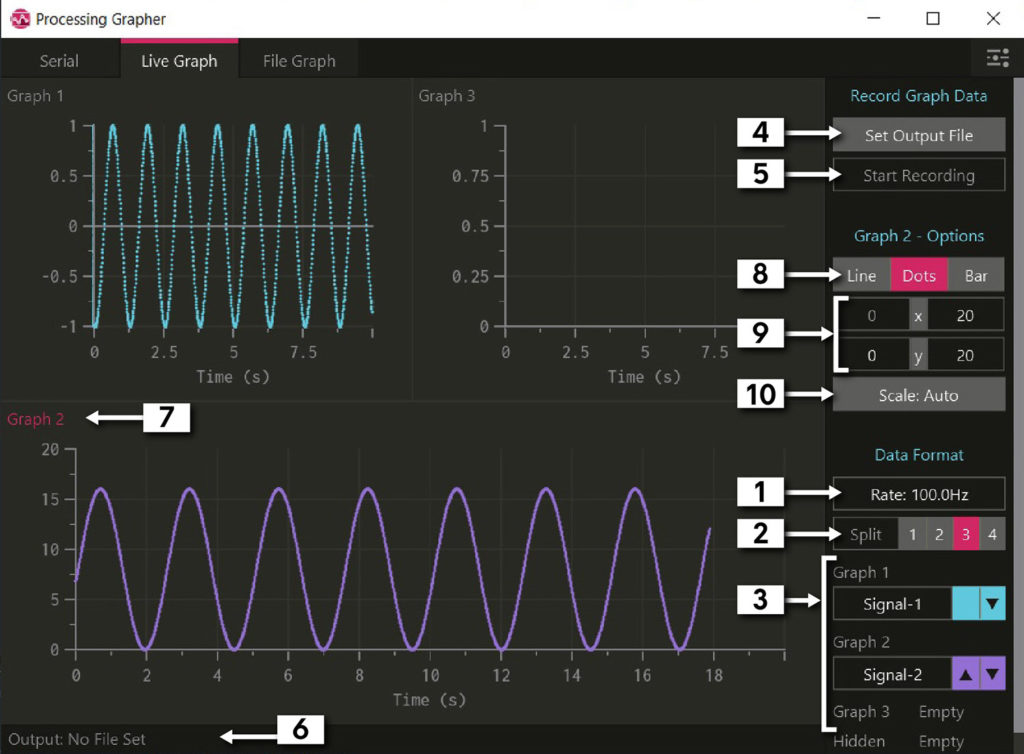 Figure 2: “Live Graph” tab that plots serial data in real-time
Format the Signals and Graphs
- First you need to tell the program the rate/frequency at which the signals are being recorded. Click on the
Rate: 100Hzbutton and input the correct frequency into the pop-up window. - The program can display incoming signals on up to 4 separate graphs. To change the number of graphs, click on the
1,2,3or4button next to theSplitlabel. - At the bottom of the right-hand menu, all of the detected signals and their respective colours are listed.
- You can click on the signal name to change the name to something different. Note: this option is disabled once data recording has been started.
- Click on the up and down arrow buttons to move the signals onto different graphs.
Recording Signals to a CSV file
- The program makes it easy to save all messages received from the serial device to a CSV (comma-separated values) data file, which can opened in spreadsheet for further analysis. Press the
Set Output Filebutton to set where the recorded messages will be saved. - Press
Start/Stop Recordingbutton to start and end the serial message recording process. - The output file path where the recorded messages will be saved is shown in the bottom status bar.
Changing Graph Settings
- To change the settings associated with a specific graph, click anywhere on the graph to select it. The title of the graph will turn red to show that it has been selected. The number of the selected graph is also shown in the menu:
Graph X - Options - You can change the way in which the data is displayed on the graph by clicking the
Line(line graph),Dots(scatter graph) orBar(bar chart) buttons. - If the value of the signals exceeds the current y-axis scaling, the minimum and maximum y-axis values will automatically be increased so that all the data fits onto the graph. However, you can also manually change the minimum and maximum Y- and X-axis values by clicking on the X and Y numbers in the menu.
- To prevent the graph Y-axis scale from resizing automatically if the data exceeds the graph bounds, click on this button to change between
Scale: AutoandScale: Manualmodes.
Sending a Serial Message/Command
While on the “Live Graph” tab, it is possible to send a serial message to the connected device without going to the “Serial” tab (for example if you need to keep an eye on the data being plotted on the graphs):
- Press the
skey on your keyboard. - If there is a serial device connected, then a pop-up window will appear where you can type the message you want to send.
The “File Graph” Analysis Tab
 Figure 3: The “File Graph” tab can plot data from a CSV file
Opening and Saving Files
The “File Graph” tab can be used to analyse data which you recorded earlier. This makes it easy to quickly look back at the data and look at regions of interest.
- To open a *.CSV data file, click on the
Open CSV Filebutton. All the signals contained within the file should be plotted on the graph. - If any changes were made to the data (such as applying a filter or adding labels), click on
Save Changesto open a dialogue which allows you to save the data to a new file. - The location of data file which is currently open can be seen on the bottom status bar.
Formatting the Signals
- To determine the X-axis of the graph, there are two options:
- If the data file contains a column which should be used as the X-axis, the heading of the column should start with the text:
x:. To show that the program has detected this column, the button (4) will show the name of the X-axis data column. - If no X-axis is present in the data file, you can set your own data rate/frequency in the exact same way as in the “Live Graph” tab. Click on the
Rate: 100Hzbutton and input the desired frequency into the pop-up window.
- If the data file contains a column which should be used as the X-axis, the heading of the column should start with the text:
- All the signals contained within the file (with exception to the x-axis column, if present) are shown at the bottom of the menu bar. To remove a signal from the graph, click on the
xbutton beside the signal name.
Changing Graph Settings
- You can change the way in which the data is displayed on the graph by clicking the
Line(line graph),Dots(scatter graph) orBar(bar chart) buttons. - You can manually change the minimum and maximum Y- and X-axis values by clicking on the X and Y numbers in the menu.
- To zoom into a specific region of the graph, click on the
Zoombutton. The mouse cursor will change to a cross. You can then click on two points on the graph, and the chart will be updated to zoom into the rectangle between those two points. To reset the graph back to its original size, click on theResetbutton.
Adding Labels and Filtering the Data
- Labels consist of a horizontal line which can be used to mark regions of interest on the graph. To add a new label, click on the
Add Labelbutton (the mouse will change to a cross), and then click on the graph to place the label marker. A new signal is added to the file to record the position of the labels. - Filters can be applied to the data by pressing on the
Apply a Filterbutton:- Select the signal you want to filter from the list which appears.
- Then select a filter to apply to the data. A selection of noise removal and mathematical filters are available.
- If any additional user input is required (for example to specify filter cut-off frequency), a pop-up dialogue will appear.
- Once complete, the filtered signal is added as a new signal to the file.
4th March 2021: Updated the images and description to reflect the latest updates to the program.
If you have any questions or suggestions, please feel free to leave a comment below!


