Response surface methodological (RSM) approach for optimizing the removal of trihalomethanes (THMs) and its precursor’s by surfactant modified magnetic nanoadsorbents (sMNP) – An endeavor to diminish
FE-SEM and zeta size analysis of sMNP indicates that the sMNP were less than 100 nm in size. sMNP size was further confirmed by TEM which specify the size to be 20 nm. BET analysis revealed that surface area of synthesized sMNP was 98.562 m2/g. Zeta potential analysis demonstrate negative charge on sMNP [(−) 58.35 mV to 74.9 mV, average value: 66.625 mV], and showed good to excellent stability against their mutual agglomeration. EDX analysis revealed that sMNP consists about 86.65% of iron whereas C, O and Au were present in 1.001%, 8.120% and 5.229%, respectively. The presence of Au was due to its use as a coating material during sample preparation for SEM-EDX analysis. The adsorption capacity, qe of sMNP was found to be 59.92 mg/g (NOM removal) and 277.33 mg/g (THMs removal) depicting their excellent potential and capability towards both NOM and THMs removal. The detailed description and characterization of the synthesized sMNP was reported in previous study29.
Mục lục bài viết
Optimization of experimental condition
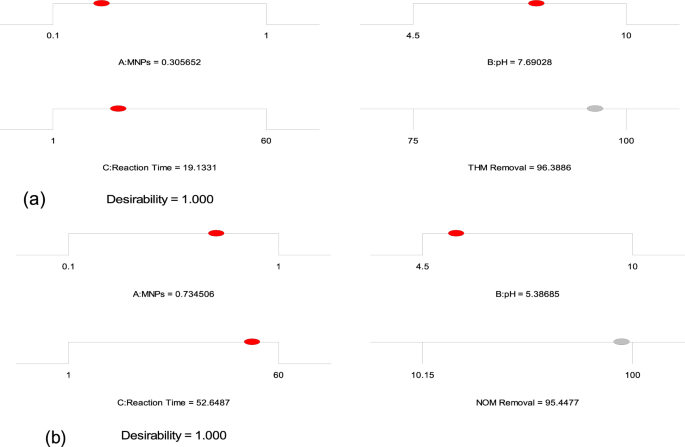
Experiments were conducted for the removal of both THMs and NOM from drinking water supplies using Design Expert model 9.0.10, USA. The upper limit of the process variables was wisely chosen for reducing chlorine dose, reaction time, and cost. The optimization program was used for setting the highest desirability and then different numerical combinations were looked for, maximizing the model functions. As shown in Fig. 2a, the optimized conditions of maximum responses for THMs removal was obtained at sMNP dose of 0.30 g/L, pH- 7.69 and reaction time of 19.13 minutes. Similarly, maximum NOM removal was achieved at sMNP dose of 0.734 g/L, pH of 5.38 and reaction time of 52.64 minutes (Fig. 2b). The optimized results were obtained at desirability (D) of 1.00, indicating the applicability of the developed models. D value closer to 1 is considered most desirable38,39. At optimized conditions, 96.38% THMs and 95.44% NOM removal was predicted by Eqs. 3 and 4, respectively. The obtained optimum conditions were further validated by an additional set of experiment to confirm the removal. This confirmatory run validated the accuracy of the model and reported 96.01% of THM and 95.21% NOM removal compared with those obtained using model equation. The experimentally observed response levels are in agreement with the model assumed theoretical values, indicating the precision and accuracy of the response surface models40.
Figure 2
Numerical optimization of process variables (a) THM Removal (b) NOM Removal.
Full size image
Development of response surface models
Response surface designs were tailored to fit the experimental results obtained from the design runs conducted in connection with the configured BBD. This resulted to an equation in coded forms, where, A, B, and C represented sMNP dose, pH and reaction time. Accordingly, the response, i.e. removal of THMs and NOM was computed using Eqs. 5 and 6, respectively.
-
(a)
THM Removal
$$THM\,removal=+100.00+1.88A-1.25B+3.13C-(1.25AB)-(2.50AC)-(1.25BC)+{(0.0A)}^{2}-{(18.75B)}^{2}-{(2.50C)}^{2}$$
(5)
(b) NOM Removal
$$NOM\,removal=+100.00+10.17A+2.81B+25.55C+3.03AB-(10.35AC)-(3.59BC)-(7.42{A}^{2})-(15.77{B}^{2})-(27.16{C}^{2})$$
(6)
Analysis of variance (ANOVA) results for both models are given in Tables 2, 3. The developed model “F-value” was found to be 210.78 (THMs) and 12.18 (NOM), depicting that both these models are statistically significant. Large F values may occur due to noise and there is only 0.01% to 0.017% chance. Values of “Prob > F” were observed to be less than 0.0500, indicating that both the model terms are significant. Model terms A, B, C, AB, AC, BC, B2 and C2 are found to be significant for THMs model while in case of NOM removal, model terms A, C, B2 and C2 are. p values for both models were observed to be is <0.001, demonstrating the level of significance for developed models. If the p-values are greater than 0.10, the model terms are insignificant29.
Table 2 ANOVA of quadratic response surface model for THMs removal.
Full size table
Table 3 ANOVA of quadratic response surface model for NOM removal.
Full size table
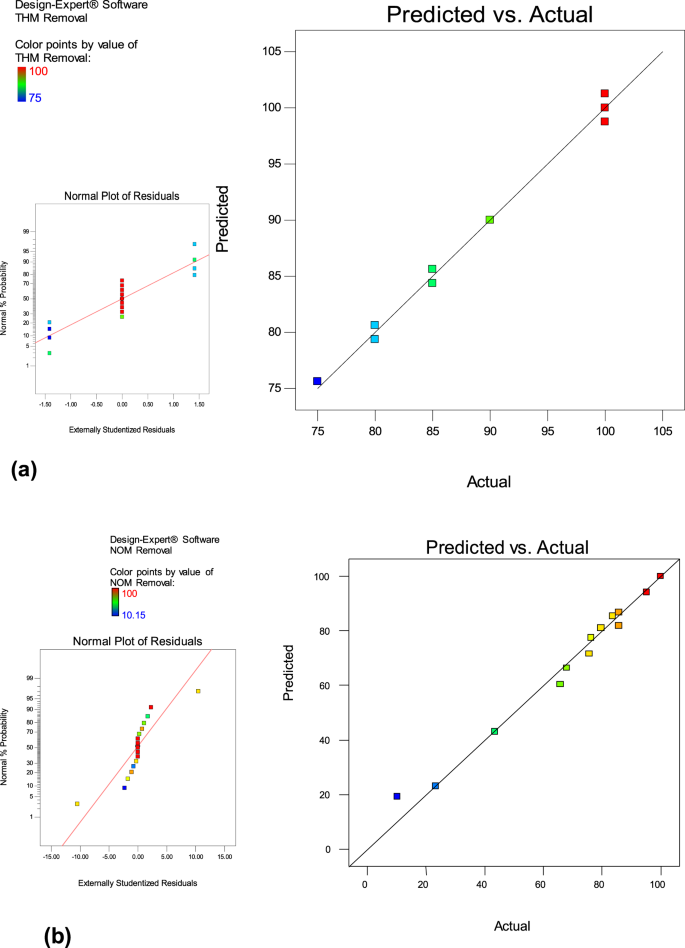
Besides p value, other statistical parameters such as coefficient of determination or R2, adjusted R2 (R2adj), predicted R2 (R2pred), coefficient of variation (CV%) etc., were also used to evaluate the competence of developed models41. R2 values and R2adj. for THMs removal was found to be 0.996 and 0.982. Similar values were obtained for NOM removal (R2 = 0.989 and R2adj. = 0.963) as well. The standard deviation for both the models were also found to be small i.e. 0.94 and 8.19 respectively. R2 values close to unity and smaller standard deviation values indicates better predicting response of the model developed30,42. The predicted R2 value was foundto be in close agreement with the adjusted R2. “Adeq Precision” determines the signal to noise ratio, of which a ratio more than 4 is desirable. In this study, the observed ratio for both models was found to be 99.42 and 5.92, respectively signifying the presence of adequate signal for navigating the design space. The developed model statistics is mentioned in Table 4. As shown in Fig. 3(a,b), the actual values are the measured response depicted by BBD and the predicted response is determined by using the approximate functions values for model evaluation. Straight line was obtained in normal % probability versus externally studentized residual plots for both these models (Fig. 3, inset Fig), thus showing normal distribution of data.
Table 4 Model statistics of the developed model.
Full size table
Figure 3
Graphical plot of predicted Vs actual values (a) THMs removal (b) NOM removal [Inside: Normal residual plots].
Full size image
Model analysis via 2D contour graphs and 3-D surface plots
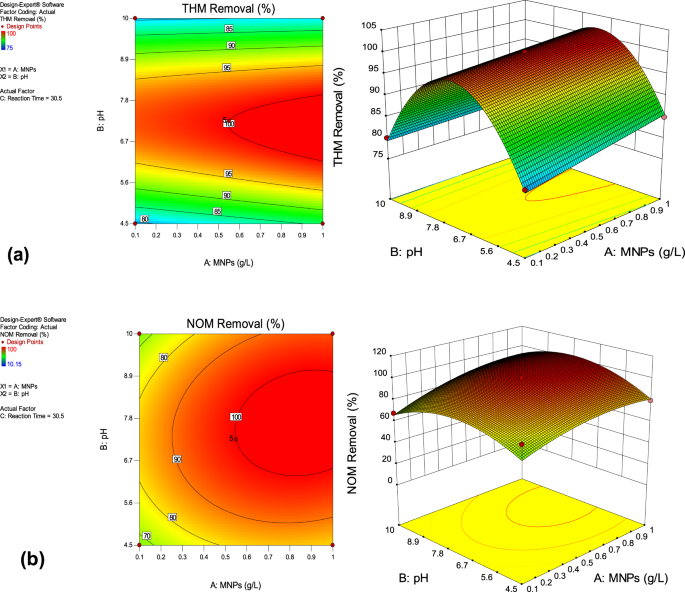
To analyze the combined effect of the factors on THMs removal, graphical representation of the regression equation i.e. 2D contour graphs and 3-D surface plots were employed (Fig. 4a). The 2D contour plot represents that complete removal of THMs was obtained in reaction time of 30.5 min and at pH 7.2, whereas slightly higher pH 7.8 values were observed for NOM removal within same reaction time. But, when pH was increased to 10, marked decrease in the THMs and NOM removal efficiencies was witnessed as depicted from 3D surface plots (Fig. 4b).
Figure 4
2D Contour and 3D surface plots (a) THMs removal (b) NOM removal.
Full size image
Cube plot
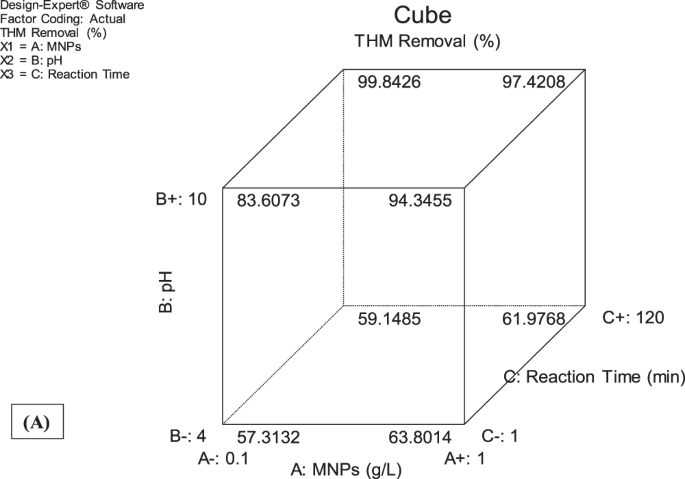
The outcome of the developed empirical models is shown via cube plot (Fig. 5A,B). The axis represents all the experimental design factors from low to high range whereas the coordinate point represents the outcome. The values depicted inside the cube represent the predicted removal efficiency of THMs by the process variable taken under study. Minimum THMs removal (57.31%) was achieved for low ranges of sMNP, pH and reaction time while maximum removal was achieved by high range of sMNP, reaction time and at neutral pH (99.84%) (Fig. 5A). Similar results were obtained for NOM removal, wherein minimum removal (45.03%) is obtained at low ranges of sMNP, pH and reaction time whereas maximum removal (94.56%) at high ranges (Fig. 5B).
Figure 5
Cube plot (A) THM removal (B) NOM removal.
Full size image
RSM analysis revealed that the removal efficiencies decrease with increase in sMNP dose and pH. Complete removal of THMs and NOM was observed at 0.52 g/L and 0.56 g/L dose of sMNP. But, a decrease in removal efficiencies was reported at higher dose. This simultaneous decrease in THMs and NOM removal at high adsorbent dosage indicated that equilibrium of adsorption was reached and was found to be constant. Comparatively lower requirement of adsorbent dose found in our study may be attributed to finer size of sMNP i.e. 20 nm as evident from TEM analysis. The pHpzc (point of zero charge) of MNPs was found to be 7.13 and at this pH, the total net surface charge on MNPs is zero. At low pH (<pHpzc), the MNPs surface has positive charge which attracts the negatively charged NOM molecules and thus enhances the rate of adsorption by reducing the zeta potential of sMNP via charge neutralization. Whereas at high pH (>pHpzc), the surface charge on the MNPs becomes negative which increases the electrostatic repulsion between NOM and MNPs surface, thereby reducing the NOM removal efficiency.
Model validation
Experiments were performed under the predicted optimal conditions to verify optimization results. Design expert software predicted significant removal of THMs (99.84%) and NOM (94.56%) under optimized conditions. The experimental results closely agreed with those obtained using RSM and therefore validated the findings of response surface optimization. A t-test was also performed to determine the biasness of the developed models. t-test is a statistical tool for hypothesis testing and follows a student’s t distribution under the null hypothesis. tstatistic values for THMs (0.325) and NOM (0.296) were less than the tcritical value (2.01), and the p values were also greater than 0.05. This demonstrated that the model biasness is insignificant. A fairly good correlation was observed between the observed and predicted values (THMs: R2 0.989; NOM: R2 0.992), indicating that the developed models are statistically significant.
Reduction in probable cancer risk
Due to the probable carcinogenic behavior of THMs on human health, it is imperative to develop treatment methods which will reduce their concentration in drinking WTPs. As reported in our previous work, the maximum concentration of TTHMs was found to be 511 µg/L in the treated water of Maithon WTP, Dhanbad, with an estimated cancer risk of 6.92 × 10⁻⁴ 43 wherein the risk assessment study was carried out in accordance with the USEPA protocol44. Under the RSM optimized conditions i.e. at an adsorbent dose of 0.30 g/L, pH 7.69 and reaction time of 19.13 min, the observed THMFP ranged from 36 to 42 µg/L. The risk analysis study revealed that under the optimized conditions, a marked reduction in the probable cancer risk was observed for all the three exposure routes in male and female (Table 5). Oral ingestion was the major route of exposure whereas risk due to dermal absorption and inhalation was found to be insignificant, as observed earlier. All the observed risk values were found to be less than 10−6, the acceptable risk level possessing no significant risk for any of the pathways studied. Thus, a marked reduction in the probable cancer risk of THMs on human health was observed under RSM optimized conditions.
Table 5 Risk reduction under optimized condition.
Full size table
Reuse of sMNP
Regeneration and reuse of the used or spent adsorbent (sMNP) is very critical in determining the applicability of the process applied. The study revealed that reusability of modified nano-adsorbents did not change significantly after five consecutive adsorption cycles for NOM (94.2–88.34%) and THMs removal (99.89–98.23%), respectively (Table 6). Out of the three desorbing solutions used, HCl has the maximum average desorbing efficiency of 96.72% and 97.59% respectively, for both NOM and THM removal. It was also observed that the increase in desorption cycle does not significantly alter desorption efficiencies caused due to the surface de-protonation of the adsorbent45.
Table 6 NOM and THMs adsorption and desorption % in 5 consecutive cycles of sMNP.
Full size table
In addition to this, the dissolved Fe concentration in the spent adsorbent was also determined to find out the stability of sMNP. AAS analysis revealed that the dissolved Fe concentration was found to be <0.2 mg/L in all the 5 cycles and hence, falls within the prescribed permissible limit for potable water i.e. 0.3 mg/L46. Accordingly, sMNP showed elevated operational reusability thereby diminishing the operational cost required for the synthesis of sMNP. Hence, sMNP exhibited ample amount of stability and is extremely capable in removing both NOM and THMs from drinking water supplies.
Possible mechanism of THM degradation
Literature study reported that the iron particle helps in degrading carbon tetrachloride. Basically, Fe particles act as a reducing agent and provide electrons for the formation of H atoms which could possibly reduce the alkyl halides by hydrogenation47. Amongst THMs, brominated ones were easier to remove than chlorinated ones. This may be attributed to the difference in the bond dissociation energies (BDE) of carbon with chlorine and bromine atoms. BDE between the C-Cl atoms, (397 ± 29) kJ/mol, is more and stronger than that of between C-Br atoms (280 ± 21) kJ/mol48,49. This demonstrates that CHCl3 is likely to be the most stable compound, whereas CHBr3, the most unstable compound. Thus, the more stable molecule is less liable to undergo a chemical reaction because of the presence of strong bonds. Therefore, a strong relationship exists between THMs degradation and their respective BDE. In addition to this, bromine substituents are better leaving groups than chlorine substituent. Hence, the possible dehalogenation of THMs is in the order of: CHBr3 > CHBr2Cl > CHBrCl2 > CHCl3.


