The Best Stock Charting Software in 2022
Mục lục bài viết
What You Should Look for In Stock Charting Software
Stock charting software helps you visualize the evolution of stocks to analyze past trends and predict future movements. No matter what kind of trader you are, charting software is an invaluable tool for making sense out of large amounts of data and deciding your next move.
With the plethora of charting tools available, you might be wondering if there is one that could work better than the one you’re using. So let’s take a look at what you should look for in stock charting software.
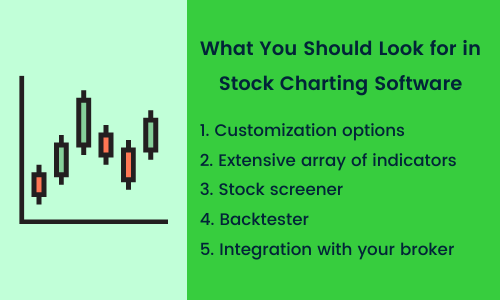
The first two things I think about when considering charting software is how user-friendly it is and whether I can save and back up chart setups. After that, there are five main criteria I look for to determine if a charting tool is worth trying out:
Customizable interface
Stock charting software typically comes with a standard interface and options like choosing the chart type, time period, displaying indicators, drawing trend lines, etc.
But to make the most of your charting software, you need the ability to create custom chart setups that present the information you need in the best way possible. Customization allows you to fit your charts any way you want within your trading setup as well as keep your charts easy to read and interpret.
Specifically, you want to be able to customize:
- Chart and background color
- Size and font of the information
- Position and color of indicators
- Layout – this is particularly important when using multiple monitors
- Level of detail – particularly the timeframe
- Live alerts
Indicators
Indicators are tools applied to price charts and displayed either on or below them. They provide insight into market trends and psychology to help you generate buying and selling signals.
You want your charting software to provide an extensive array of indicators so you can derive as much insight as you need from stock data.
How many indicators you need depends on your trading style and goals. That said, there are essential indicators that most traders need to keep track of, including:
- Moving Average (MA): a technical indicator that calculates average prices to reduce the noise and clarify the trend direction.
- Moving Average Convergence Divergence (MACD): a momentum indicator that indicates the relationship between two moving averages and helps identify trends and reversals.
- Relative Strength Index (RSI): a momentum indicator that shows if a stock has been overbought or oversold.
- Volume Weighted Average Price (VWAP): an indicator that calculates the average price of a stock on a given day based on the volume traded.
These are just some of the most commonly used indicators and there are many others that may prove useful for your technical analysis.
Keep in mind that, at the end of the day, the charting software tool with the most indicators isn’t necessarily the best. You need to be clear on the combination of indicators (both overlays and oscillators) that works best for you and then find the charting solutions that do provide them.
Screener
Stock screeners and charts are two complementary research tools. Your screener scans through countless stocks to find those that fit your trading strategy, and your charts let you take an in-depth look at each interesting stock. So this is another important feature you want to make sure is included in your charting software.
Great stock charting software will have a built-in screener with a UI and customization options that are as good as the charting tool itself.
A good screener should allow you to:
- Access a library of pre-set scans
- Filter stocks by technical and fundamental indicators
- Save your scans as hypothetical portfolios
- Export your scans
Quick note: don’t forget to check which exchanges and assets are included in the screener.
Backtester
Another important tool in technical analysis is backtesting. By applying a strategy to historical data, you can evaluate its performance before executing it in the real market. If a strategy works with past data, there’s a good chance it’ll work in the future too.
Unless, of course, a big change occurs in the market, which is why you need to factor in market conditions in addition to formulating a hypothesis with clear metrics and indicators.
Some of the most commonly sought backtesting metrics include:
- Net profit or loss
- Win/loss ratio
- Return
- Drawdown
- Volatility
- Compounded return
To conduct backtesting manually, you need to use good charting software, one that has clear charts and gives you access to plenty of historical data.
Integration with your broker
Last but not least, check if the software tool you’re interested in integrates with your brokerage.
You should be able to log into your broker account directly from your charting software to place trades. So be sure that the broker you use is included among the integrations.
Moving seamlessly from your charting software to your broker is a lot more efficient than having to switch manually between two platforms all the time.

Now that you know what you should look for when looking for charting software, It’s time to dive into my personal recommendations for the best stock charting software to use in 2022.
Improve Your Trading Performance with Tradervue
Record your trades, analyze your performance, and share your notes to refine your trading strategies and consistently increase your profits.
Try it free for 7 days
1. TradingView
TradingView is one of the most popular online platforms for trading. It’s also an excellent stock screener and stock charting tool that I love using. If you have used it before, you know how well-designed and feature-packed it is.
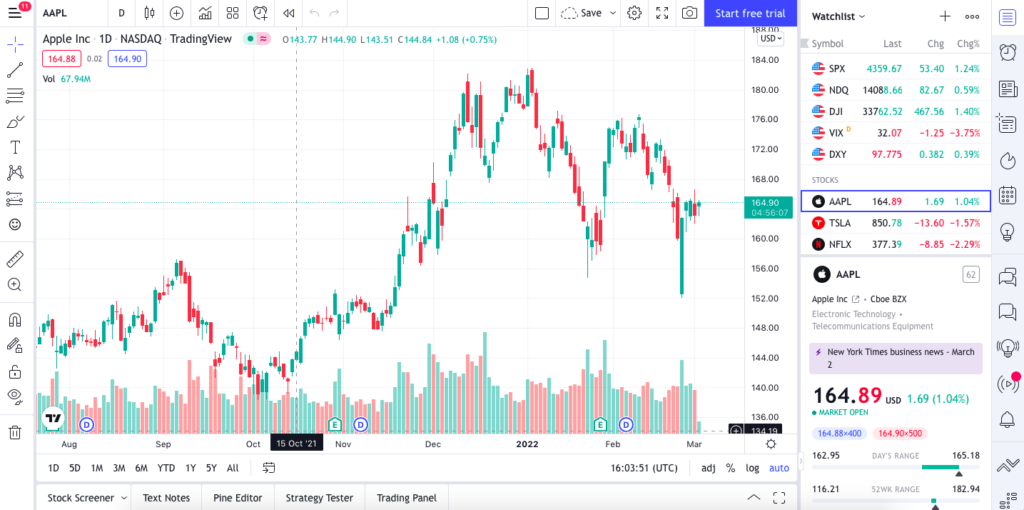
So how does TradingView fare as a stock charting tool? Well, I have relied on it for years and can say that it’s nothing short of great. Let me elaborate.
Why I recommend TradingView
I recommend using TradingView for several reasons. First, it’s one of the best stock screeners around. Its engine is powerful and you can customize your screener as you see fit.
TradingView is also a great tool for backtesting. You can test strategies on stocks, Forex, and cryptocurrencies. Plus, you can use PineScript to create custom indicators and test strategies.
When it comes to charting, you can use most chart types and indicators. You also have 50+ drawing tools at your disposal and can set up alerts on price, indicators, and strategies. Furthermore, the interface is clean and you can open up to 8 charts per tab if your monitor is large enough.
What you need to know about TradingView
TradingView has a large community of users (30 million monthly users), meaning you can chat with traders and exchange insights in real-time – pretty handy if you like to get the perspective of others. There are also live streams you can watch.
Also, and like I said, TradingView is a trading platform, so jumping from your charts to your broker account is a quick, seamless process. You’ll save a lot of time each day thanks to the integration with brokers. There is also a mobile app you can use anywhere you go.
When it comes to pricing, TradingView has three paid plans:
- Pro: $14.95/month
- Pro+: $29.95/month
- Premium: $59.95/month
For a trading platform with a built-in screener and stock charting tool, TradingView is quite affordable. On top of that, there are frequent sales, so with good timing you might save money as you subscribe to a paid plan. All three plans have a 30-day free trial, so at the very least you should give TradingView a try.
Negatives to keep in mind
There isn’t really a major drawback that I can think of. TradingView is definitely one of the best stock charting software – I would say it would easily land in a top 3. That being said, there are other stock charting tools that are very much worth looking into.
2. eSignal
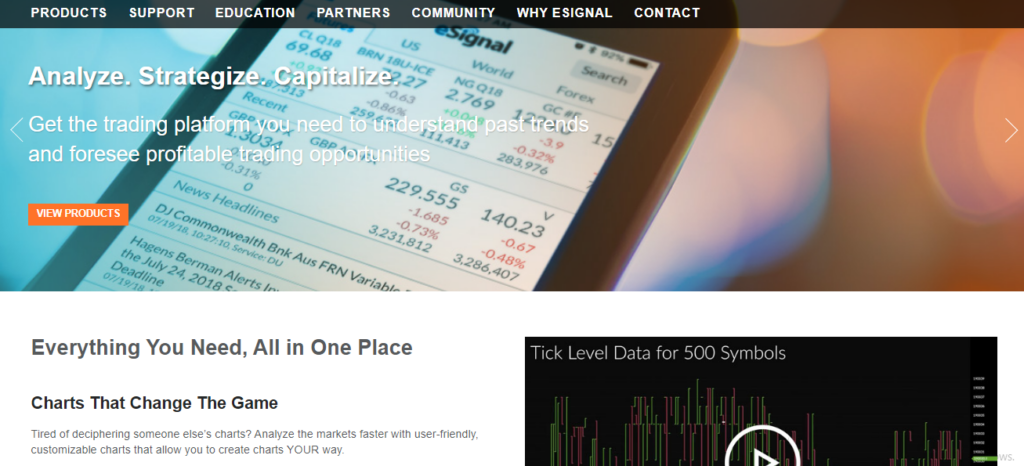
Another powerhouse of stock charting is eSignal, a comprehensive platform that serves as a trading platform, charting software, stock screener, backtester, news aggregator, and more.
Why I recommend eSignal
When I first used eSignal for charting, I was impressed with the variety of charts available (Bar, Candle, Histogram, Renko, 3 Line Break, etc.) and how customizable they are
I can choose from a large variety of intervals and can insert as many indicators and symbols as I need. Plus, I can freely change the font, size, background color, and other visual elements of a window and save it as a style template I can reuse later. There are also many advanced drawing tools like the Fibonocci tools.
Furthermore, if you like to develop your own studies, you can use eSignal’s scripting language.
Really, I’ve barely scratched the surface of what you can do with eSignal. Suffice to say that the customization possibilities are practically endless.
eSignal also includes Market Screener +, a built-in stock screener, as well as a solid backtester for testing your strategies. Add to that comprehensive educational resources along with great customer service and it’s no surprise that I strongly recommend eSignal.
What you need to know about eSignal
As a trading platform, eSignal directly integrates with 50+ brokers, including Interactive Brokers, Lightspeed, TD Ameritrade, and many more. This makes it very quick and convenient to place trades.
You must be wondering about the pricing, so let me tell you this: eSignal doesn’t come cheap. The three paid plans — Classic, Signature, and Elite — are priced respectively at $58/month, $192/month, and $391/month (exchange fees are not included). The Classic tier offers all the core features but the intraday data has a 15-minute delay. The higher-priced tiers provide real-time data and access to even more tools and resources. Note that you can save up to a few hundred dollars by choosing the annual billing.
Another thing worth mentioning is that you need a powerful PC to run eSignal smoothly — at least 8 GB of RAM. There is also a mobile app on Android and iOS.
Negatives to keep in mind
eSignal is one of the best charting platforms you can find, but it’s rather expensive when compared to other options. Depending on your budget, you might want to go with another option. But if you can afford it, eSignal really has everything you could ask for.
Also, keep in mind that eSignal is not compatible with Mac and Linux, so if you use one of these operating systems, you’ll have to go with another software.
3. TC2000
Like TradingView and eSignal, TC2000 is a very popular trading platform that also serves as a stock charting tool and stock screener.
Why I recommend TC2000
For starters, TC2000 is very user-friendly. It’s simple to install and the UI is very clean and organized.
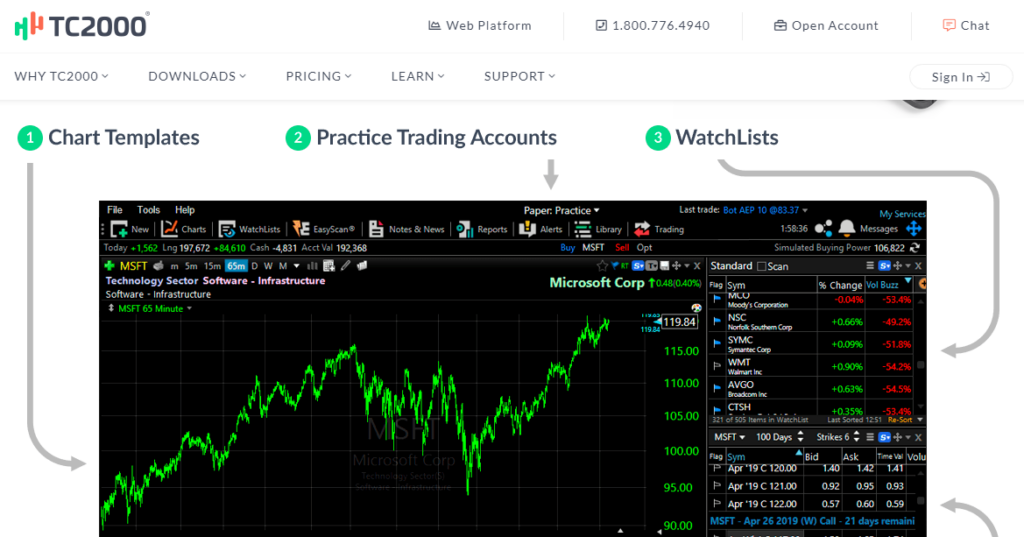
One thing I love about TC2000 is the layouts. I can choose from a variety of layouts as well as create my own. I can also freely move and dock a chart anywhere on my screen; this is very helpful for visualizing multiple stocks at the same time. And this is just a fraction of what you can do with layouts.
TC2000 also has pretty much all the technical indicators (over 100) and drawing tools you may need. It also includes EasyScan which is one of the best stock screeners.
Also, I find the Volume buzz screener to be extremely useful for identifying stocks with good activity at a glance. Simply put, it’s a column you add to your watchlist to keep an eye on the trading volume of stocks. You’ll see a percentage (either positive or negative) displayed next to the stock price, and it tells you which stocks are buzzing. It’s a simple and handy tool to not miss out on interesting stocks.
What you need to know about TC2000
TC2000 includes option charting, which is a feature you won’t find in many other charting tools.
This charting software is available on Windows and can run on Mac if you use Windows emulation software like, and mobile devices Parallels Desktops. It’s also available on mobile devices.
The pricing is rather affordable, with three tiers (Silver, Gold, and Platinum) being priced respectively at $9.99, $29.99, and $89.99 per month. Like other platforms, you get a discount for choosing the annual or bi-annual billing cycle. To unlock the full potential of TC2000, you’ll have to choose either the Gold or Platinum plan. I should also mention that you might have to pay an extra for optional data feeds like real-time US options.
Negatives to keep in mind
For all its advantages, TC2000 hasn’t received many updates lately. So if you find something that you are not satisfied with, you might get stuck with it for a while.
Additionally, TC2000 does not have a built-in backtester, so you will have to use a separate backtesting tool to test your strategies.
4. TrendSpider
TrendSpider is another popular platform which has a lot to offer in terms of charting and technical analysis. But it main selling point is the automation of technical analysis
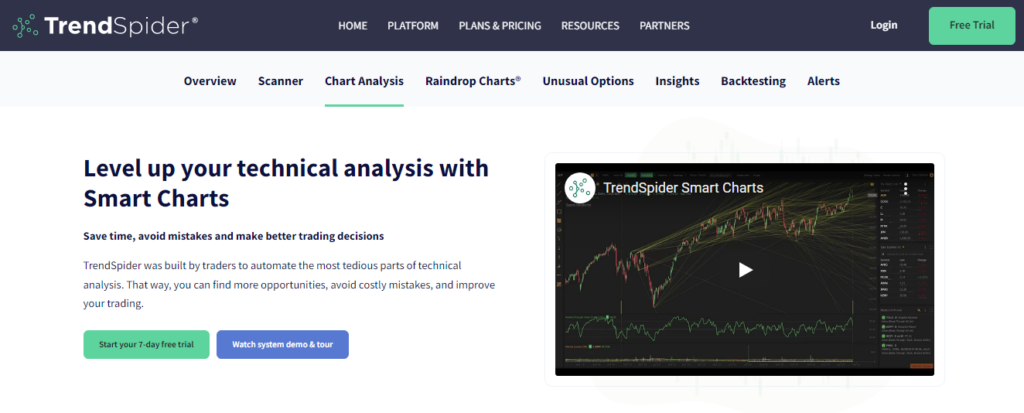
Why I recommend TrendSpider
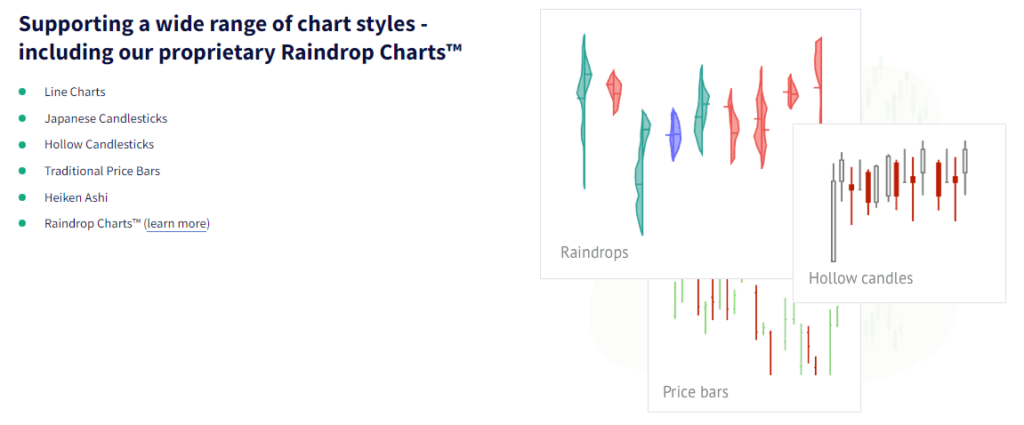
TrendSpider has an extensive library of chart types. Below are a few of the charts you’ll be able to display:
- Line charts
- Japanese Candlesticks
- Hollow Candlesticks
- Fibonacci sequences
- Traditional Price Bars
- Heiken Ashi
- Raindrop Charts
RainDrop Charts in particular are very useful. Here’s how Ruslan Lagutin, Co-Founder and CTO of TrendSpider defines this type of chart in his white paper:
“The Raindrop Chart is a new type of financial timescale price chart that attempts to abstract away arbitrary constructs, such as open and close prices, to instead focus on changes in volume and market sentiment. In other words, Raindrop charts ignore artificial breakpoints wherever possible. The Raindrop visualization illustrates price and volume movement instead of just the price change. Briefly, it’s a human-friendly Volume Profile chart.”
Ruslan Lagutin, Co-Founder and CTO of TrendSpider
RainDrop Charts have made it a lot easier for me to visualize the market sentiment and price consensus. They reduce noise while adding the factor of volume to trendlines and indicators.
Speaking of indicators, TrendSpider provides over 120 indicators like the Absolute Price Oscillator, Bollinger Bands (R) and Historical Volatility Ratio to mention a few.
After having used TrendSpider for a long time, I can attest to the quality of its stock screener and backtester, respectively called Market Scanner and Strategy Tester. They’re both easy and powerful.
What you need to know about TrendSpider
TrendSpider is 100% web-based, so you don’t need to download and install it on your computer. Plus, if you like consulting your charts from a mobile device, you can use the TrendSpider app on both iOS and Android.
TrendSpider has a 7-day free trial for each of its three plans, which are as follows:
- Premium: $36.67/month – best for traders with a day job
- Elite: $72.5/month – for experienced traders
- Advanced: $109.17/month – for professional, full-time traders
Negatives to keep in mind
While TrendSpider works great for charting, there isn’t a built-in news feed, so you’ll have to use another online platform in tandem with it to get the latest market news.
Also, TrendSpider is fully web-based, meaning there is no desktop version. You can use the browser and the mobile app on Android and iOS. Depending on your preferences, this may or may not be a negative.
The Best Stock Charting Software: Closing Thoughts
So there you have it: these are the charting software tools that I consider to be the best.
While I have provided you with my personal recommendations, be sure to do your own research and find out which software works best for you. Determine the exact features you need, then compare features and pricing.
While charting is a must-have tool, to achieve trading success, it’s also important to hone your trading skills consistently. The best investment for that is an online trading journal where you can record your activity and develop winning trading habits.
Tradervue is a top-rated trading journal you can use to keep a journal, share notes, and analyze your trades with tools that can complement your charting software. Start your trading journal for free today and improve your trading.
Improve Your Trading Performance with Tradervue
Record your trades, analyze your performance, and share your notes to refine your trading strategies and consistently increase your profits.
Try it free for 7 days


