UML Timing Diagram – Javatpoint
← prev
Mục lục bài viết
UML Timing Diagram
In UML, the timing diagrams are a part of Interaction diagrams that do not incorporate similar notations as that of sequence and collaboration diagram. It consists of a graph or waveform that depicts the state of a lifeline at a specific point of time. It illustrates how conditions are altered both inside and between lifelines alongside linear time axis.
The timing diagram describes how an object underwent a change from one form to another. A waveform portrays the flow among the software programs at several instances of time.
Following are some important key points of a timing diagram:
- It emphasizes at that particular time when the message has been sent among objects.
- It explains the time processing of an object in detail.
- It is employed with distributed and embedded systems.
- It also explains how an object undergoes changes in its form throughout its lifeline.
- As the lifelines are named on the left side of an edge, the timing diagrams are read from left to right.
- It depicts a graphical representation of states of a lifeline per unit time.
- In UML, the timing diagram has come up with several notations to simplify the transition state among two lifelines per unit time.
Basic concepts of a Timing Diagram
In UML, the timing diagram constitutes several major elements, which are as follows:
Lifeline
As the name suggests, the lifeline portrays an individual element in the interaction. It represents a single entity, which is a part of the interaction. It is represented by the classifier’s name that it depicts. A lifeline can be placed within a “swimlane” or a diagram frame.
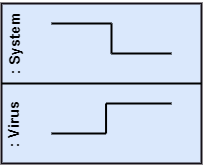
Lifelines representing instances of a System and Virus
State or Condition Timeline
The timing diagram represents the state of a classifier or attributes that are participating, or some testable conditions, which is a discrete value of the classifier.
In UML, the state or condition is continuous. It is mainly used to show the temperature and density where the entities endure a continuous state change.
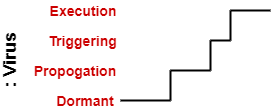
Timeline showing the change in the state of virus between dormant, Propagation, Triggering, Execution
Duration Constraint
The duration constraint is a constraint of an interval, which refers to duration interval. It is used to determine if the constraint is satisfied for a duration or not. The duration constraint semantics inherits from the constraints.
The negative trace defines the violated constraints, which means the system is failed. A graphical association between duration interval and the construct, which it constrains, may represent a duration constraint.
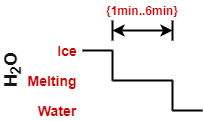
Ice should melt into the water in 1 to 6 mins.
Time Constraint
It is an interval constraint, which refers to the time interval. Since it is a time expression, it depicts if the constraint is satisfied or not. The constraints dispense its time constraints semantics.
The negative trace defines the violated constraints, which means the system is failed. The time constraint is represented by a graphical association between the time interval and the construct which it constrains.
The graphical association is mainly represented by a small line in between a time interval and an occurrence specification.

A person should wakeup in between 5:40 am, and 6 am
Destruction Occurrence
The destruction occurrence refers to the occurrence of a message that represents the destruction of an instance is defined by a lifeline. It may subsequently destruct other objects owned by the composition of this object, such that nothing occurs after the destruction event on a given lifeline. It is represented by a cross at the end of a timeline.
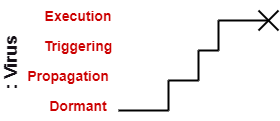
Virus lifeline is terminated
Example of a Timing Diagram
A timing diagram example of a medical domain that depicts different stages of Alzheimer’s disease (AD) is explained below.
Since Alzheimer’s is a very progressive fatal brain disease, it leads to memory loss and intellectual abilities. The reason behind this disease is yet to be discovered. It cannot be cured as well as one of the main reasons for rising death rates in the United States.
The doctor may require a diagnostic framework with three to seven-stage, such that its evolution may last for about 8 to 10 years. Also, in some cases, it lasts up to 20years from the time neuron starts changing.
The example given below constitutes timing for a seven-stage framework. The given example is just a UML diagram and should not be considered as a reference to medical research. The medical details are provided for you to better understand the UML diagram.
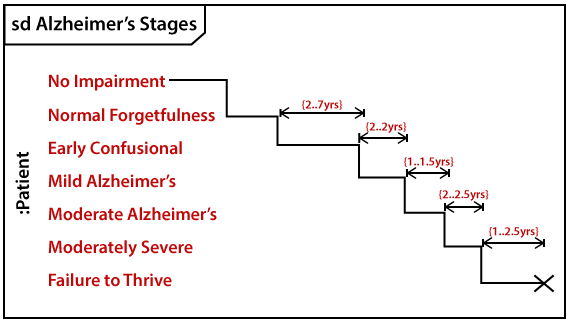
Following are the seven-stage Alzheimer disease framework explained below:
- No Impairment, Normal State
It is the stage where the memory and cognitive abilities look normal. - Normal Aged Forgetfulness
It is mostly seen in people with an age group of 65 who experience subjective complaints of cognitive and/or functional difficulties, which means they face problems in recalling the name and past 5 to 10 years of history. - Early Confusional, Mild Cognitive Impairment
It causes a problem in retrieving words, planning, organizing, objects misplacing as well as forgetting fresh learning, which in turn affects the surrounding. - Late Confusional, Mild Alzheimer’s
In this, a person forgets the most recent events and conversations. The person remembers himself and his family, but face problems while carrying out sequential tasks such as cooking, driving, etc. Its duration is about two years, - Early Dementia, Moderate Alzheimer’s
In this, the person cannot manage independently. He faces difficulty in recalling the past details and contact information. It lasts for about 1.5 years. - Middle Dementia, Moderately Severe Alzheimer’s
It leads to insufficient awareness about current events, and the person is unable to recall the past. It causes an inability in people to take a bath and dress up independently. It lasts for about 2.5 years approximately. - Late or Severe Dementia, Failure to Thrive
It is severely limited intellectual ability. In this, a person either communicates through short words or cries, which leads health to decline as it shut down the body system. Its duration is 1 to 2.5 years.
Benefits of Timing Diagram
- It depicts the state of an object at a particular point in time.
- It implements forward and reverses engineering.
- It keeps an eye on every single change that happens within the system.
Drawbacks of Timing Diagram
- It is hard to maintain and understand.
Next Topic
UML Tools
← prev
next →


