
What does the Bitcoin NUPL indicator tell us?
Hello dear friends.
The Net Unrealized Profit/Loss (NUPL) indicator is an on-chain indicator that determines the difference between unrealized profit and unrealized loss, thus showing whether the market is going through a profit or loss state.
Source: edited image, original from pixabay.com.
This indicator tells us what would happen if an investor decided to sell his coins today, whether he would make a profit or a loss. The NUPL is an indicator that evaluates the difference between the price when an UTXO was created and its current price, so that an investor can evaluate whether the coins corresponding to that UTXO are in a state of unrealized profit, i.e. they have increased in value, or whether, on the contrary, they are in a state of unrealized losses.
To generate this indicator, the difference between unrealized losses and unrealized gains is calculated, so that when it acquires a value greater than zero it indicates that at that moment the network is in profit, while values less than zero indicate a state of loss. The indicator is shown on a graph as a curve that oscillates between positive and negative values, and in general, the further the NUPL curve moves away from zero, the closer the prices are to the market highs or lows.
We can also observe a color scale that can help investors identify more quickly what state the market is in, with the blue color on the indicator line identifying the euphoric phase, signaling that it is time to take profits, and the red color when the indicator takes on negative values, signaling that it is approaching a bottom, which creates the possibility of re-entering the market.
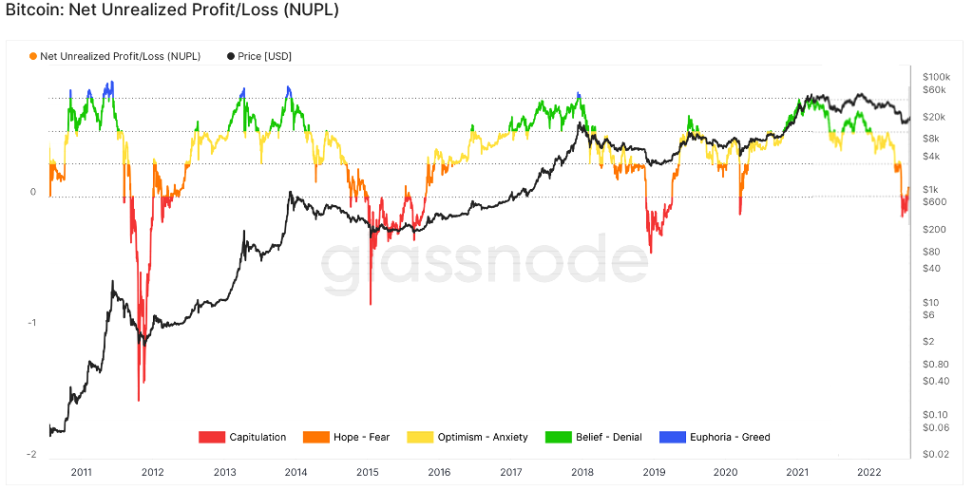
Screenshot taken from Glassnode.com.
In the image above we can observe the NUPL indicator in a price chart for Bitcoin, and as we can observe, the highs in the market have been reached when the indicator approaches 0.75; and the lows have been recorded when the indicator crosses below zero.
In the recent bear market we can see that the indicator acquired negative values last June, something that had not happened since March 2020, on June 18 it reached a low of -0.16 barely lower than the one reached in March 2020. And this negative value tells us that last month unrealized losses were 16% higher compared to unrealized gains. But as we can also appreciate, the current low is closer to the 2020 low but is much higher than the 2018 and 2015 lows.
The interesting thing about this indicator is to see what happens after the NUPL values return above zero, which seems to be the signal that the market has exited the capitulation phase.
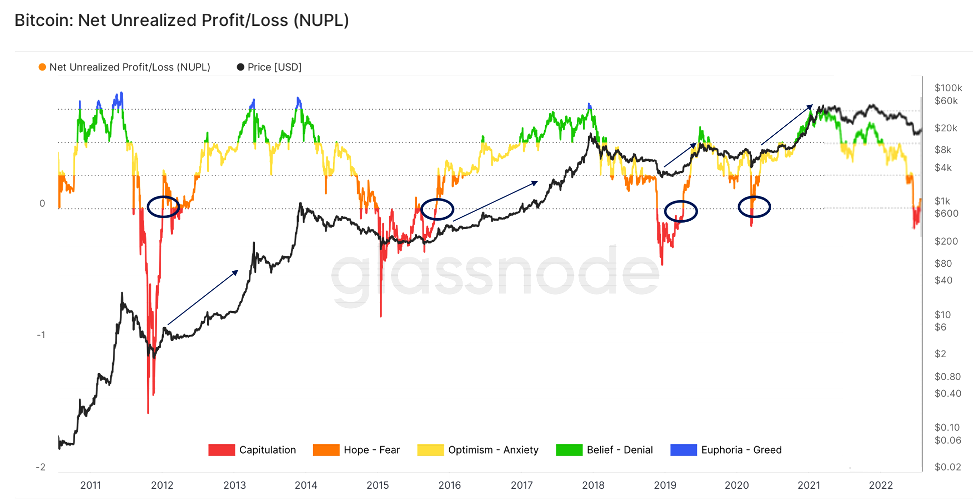
Screenshot taken from Glassnode.com and edited in Powerpoint.
As we see in the chart above, in 2015 as well as in 2018 and 2020, growth phases have started after the indicator leaves the zone of negative values. And seeing that last July 17 the indicator returned to the zone of positive values, so it is possible that the BTC has already bottomed and the market begins to recover.
Well friends, I hope you liked the information about the NUPL indicator, and let me know what you think, has the BTC already bottomed out.
Thanks for reading, see you next time!
Posted Using LeoFinance Beta


