
Top 12 System Monitoring Tools for Windows Environments of 2023
System Monitoring is without question one of the most important tasks for IT admins, because it helps them guarantee that all servers are working at top performance. While Windows’s own monitoring tool “Task Manager” is very useful for casual resource monitoring, it lacks added features that other tools have, like alerting, notification, reporting, etc.
Using the right monitoring tool will help you keep all infrastructures’ health information in control and alert you about any unplanned downtime.
The tools that monitor the infrastructure should be designed to add the least performance impact on the system that is being monitored. In other words, these tools need to be as unobtrusive as possible to avoid any added burden on the production services.
Here is our list of the best system monitoring tools:
A monitoring tool should also add flexibility to the maintenance of the network. In a medium to large network, a central monitoring server will help offload the added impact on the systems being monitored.
Basically, the central server collects monitoring data from all agents installed in the servers. An agent is low-impact software that collects information of the server that is hosting it and sends it to the central server in order to process it.
When looking for a system monitoring software package there are many things to consider. Apart from the basic monitoring functionalities such as processes and system performance, it is essential that the tool allows the following features
- Customizable alerts and notifications.
- Auto-discovery of systems.
- Easy graphical user interface.
- Automatic update measurements.
- Easy Installation and operation.
Mục lục bài viết
What should you look for in Windows system monitoring tools?
We reviewed the market for system monitors for Windows and analyzed the options based on the following criteria:
- A package that is able to track the activity of the operating system and services
- A monitor for network interfaces as well as on-device activity
- A monitor for applications resident on Windows
- Performance tracking for software packages
- A self-installing, easy-to-use service
- A risk-free assessment opportunity with a free trial or a demo service
- Good value for money in a paid tool or a free tool that is worth operating
With these selection criteria in mind, we have identified some very strong system monitors for Windows.
Here’s a List of the Best System Monitoring Tools and Software:
Windows users deal with a large variety of options when it comes to systems monitoring tools. The following list details 7 tools and software on the market that will help you keep a close eye on your infrastructure if your primarily a Windows Server (2012, 2008, 2003, etc).
The nice part about these tools is that most of them have agentless monitoring systems (utiltizing services such as HTTP, PING, SSH, etc) to monitor devices that are not Windows based, such as Linux, Unix, Mac OSX and others.
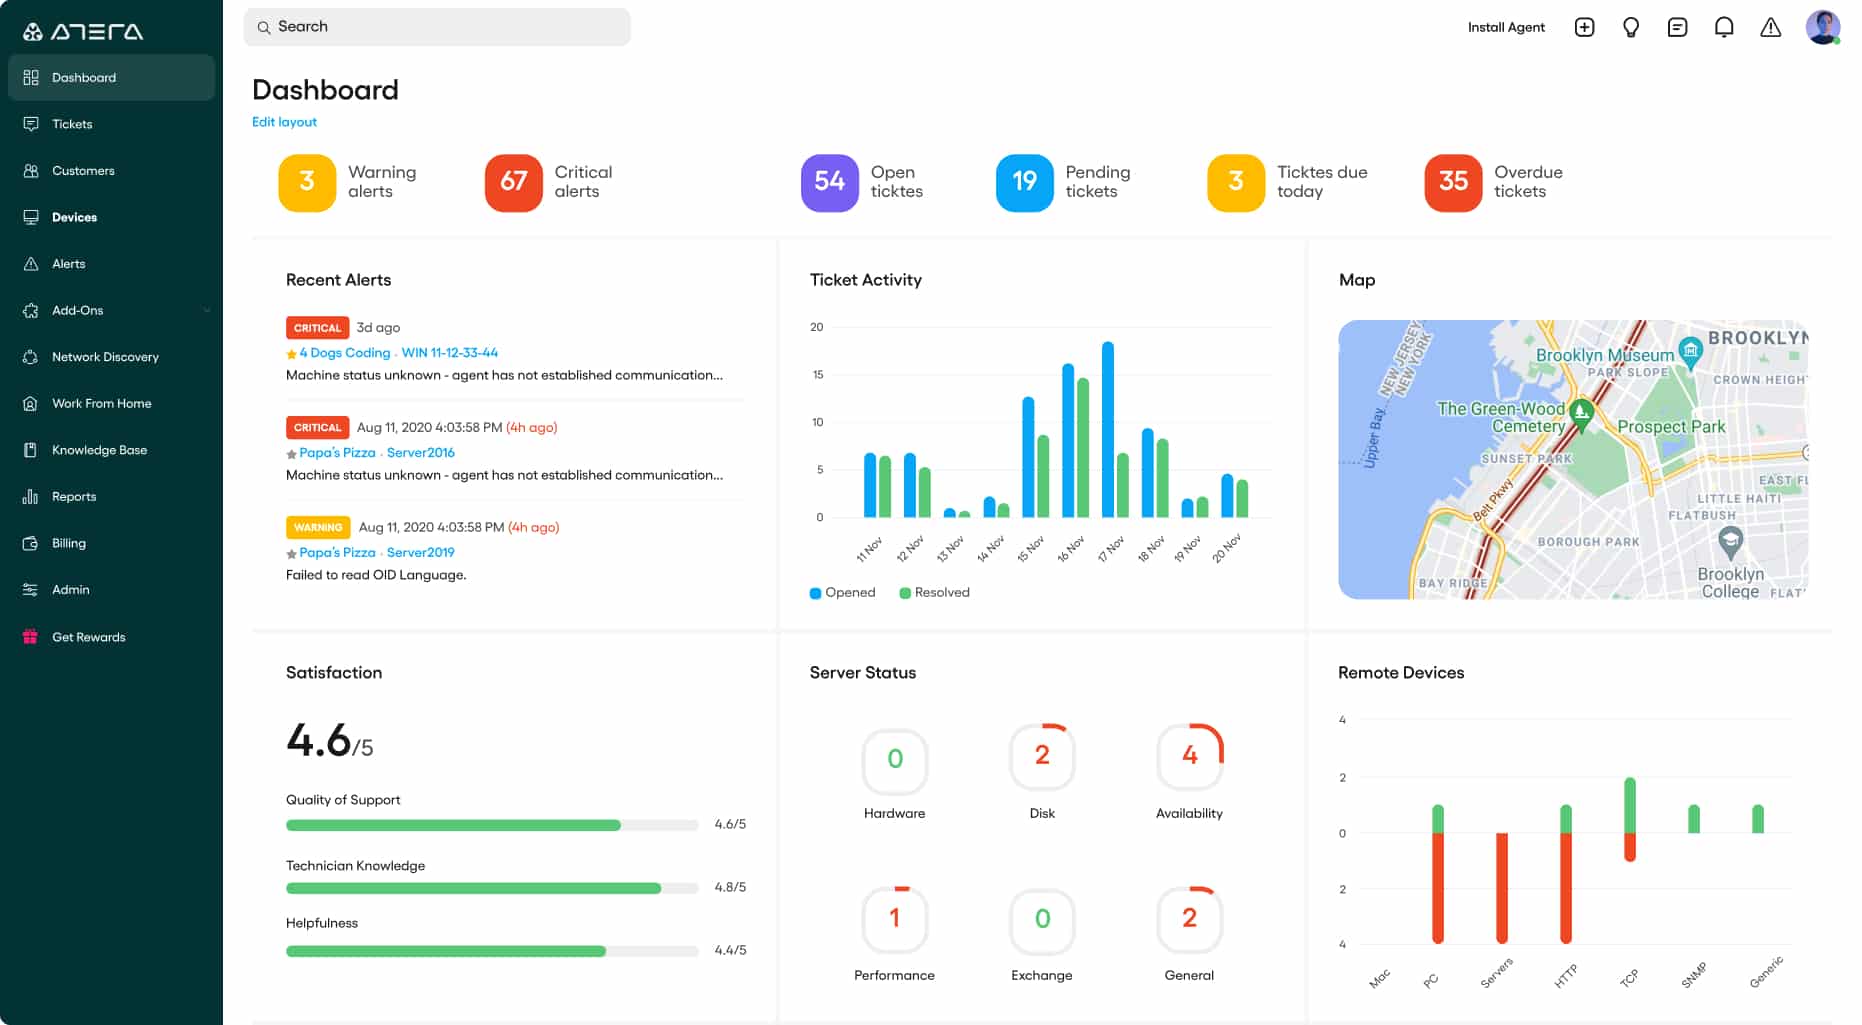
Atera is a SaaS package that provides professional services automation (PSA) and remote monitoring and management (RMM) tools for managed service providers (MSPs). The RMM system includes endpoint monitoring services for Windows PCs and Macs.
Key Features:
- Intuitive interface
- Highly customizable
- Robust access controls
The monitoring services in the Atera RMM watch over networks and applications as well as endpoints. The device status tracking service displays metrics live in the Atera dashboard. These include system resources and application activities. The package also includes performance thresholds that will draw the attention of technicians to the dashboard if problems arise.
The Atera system also includes a Patch Management service to keep Windows and macOS up to date plus the applications that run on top of them.
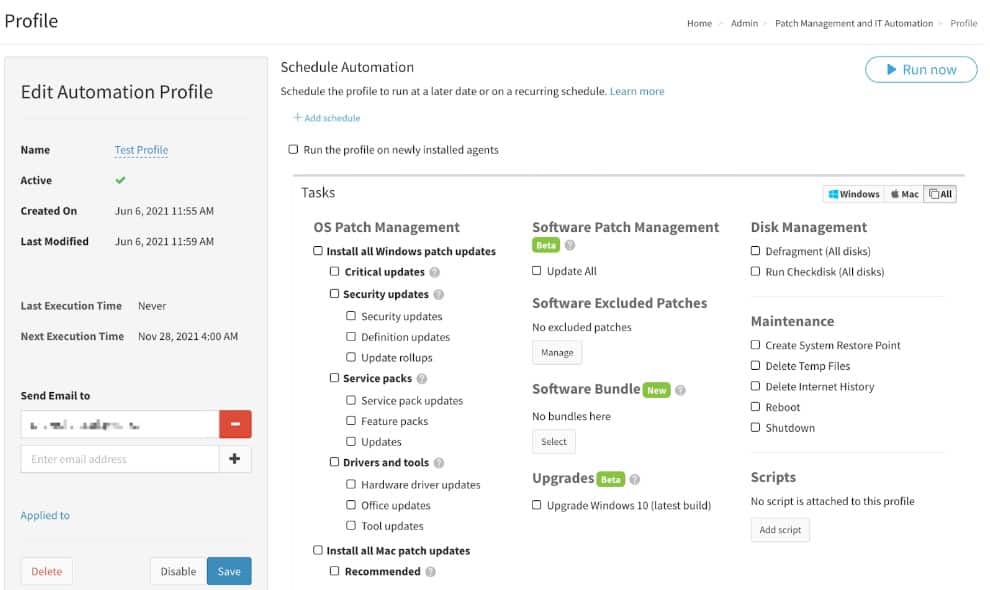
The Patch Management interface can also be used to launch maintenance tasks on a schedule. The system provides a high degree of automation that creates the maximum value for money by reducing the need for technician involvement.
Pros:
- Delivered from the cloud and accessed through any standard Web browser
- Includes ticket management and remote access for support
- Provides task automation and alert-based notifications
Cons:
- Automatic device discovery is a paid extra
Atera is charged for by subscription that can be paid monthly or annually with rates starting at $99 per month. You can examine the service with a 30-day free trial.
Official Website: https://www.atera.com/lp/rvw/remote-it-management-v2/
EDITOR’S CHOICE
Atera is our top pick for a system monitoring tool for Windows environments because it provides full Windows monitoring in all of its packages – macOS monitoring is only included in higher plans. IT departments are catered for by Atera in its packages that offer tools for support teams that can be used to monitor multiple sites simultaneously. Managed service providers get a multi-tenant version of the platform to monitor and manage the sites of clients without mixing the data of each customer. A ticketing system and a module for contract and service level agreement management are also available for MSPs. The top package gives you file transfer and storage facilities of up to 50 GB per month, which can be used to back up data. This system includes task automation tools, such as software deployment and patching systems to give you the maximum value out of each technician.
Download: Get a 30-day FREE Trial
Official Site: https://www.atera.com/signup/
OS: Cloud-based
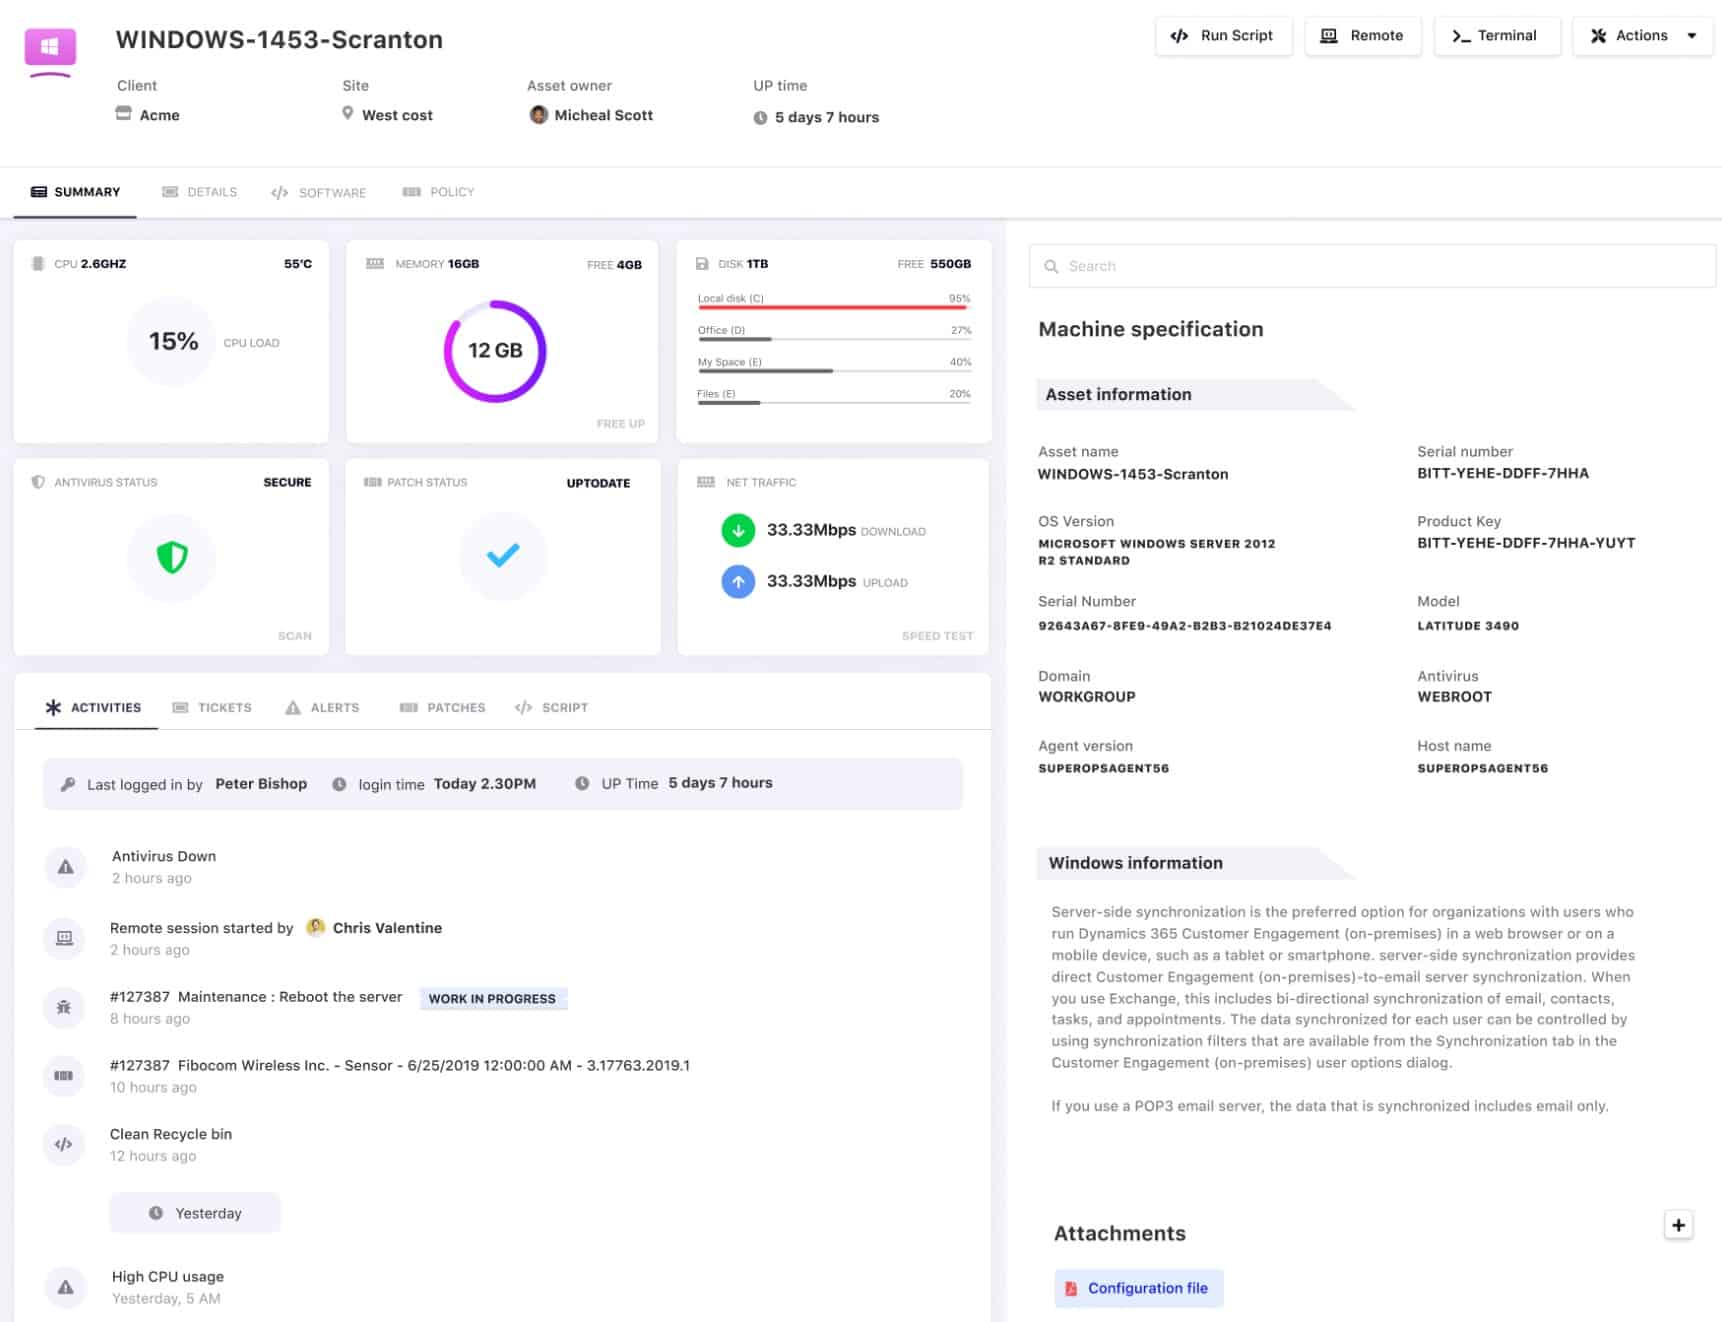
SuperOps is a SaaS package that provides remote monitoring and management tools for use by managed service providers and IT departments. The package includes automated processes for monitoring computers running Windows. The package also provides management systems that include a patch manager.
Key features:
- Asset registry
- Software license management
- Patch management
The endpoint monitoring facility in the RMM provides supervision for devices running macOS as well as for those with Windows. The service includes performance expectation thresholds that trigger alerts if crossed. These enable a single technician to manage many endpoints simultaneously, creating high productivity.
The endpoint management service includes a patch manager that updates Windows, macOS, and the software packages that run on those devices. The patching system operates unattended, running automatically at the next available maintenance window. Completion statuses are recorded to assist with compliance reporting.
Pros:
- Suitable for MSPs or IT departments
- Web-based console that can be accessed from anywhere
- The ability to manage endpoints on multiple sites
- Automated monitoring with alerts
- Patching status reports
Cons:
- No on-premises version
Official website: https://superops.ai/rmm
Download: Start with a 21-day free trial: https://superops.ai/signup
Start 14-day Free Trial!
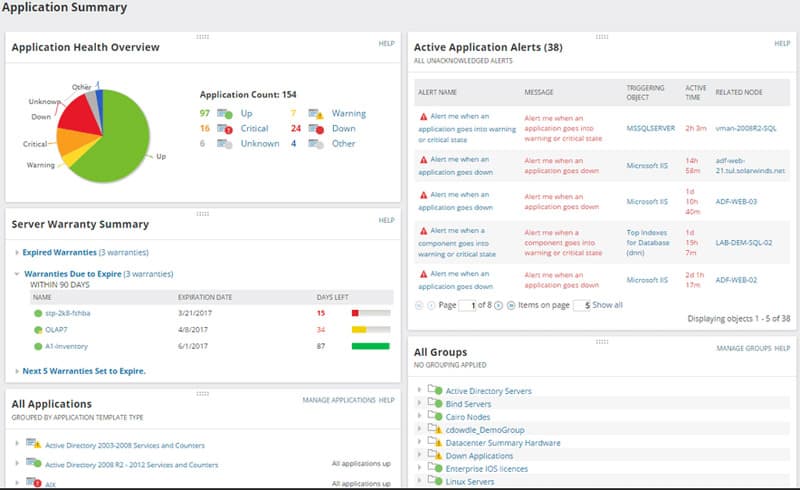
SolarWinds, has been a long-time leader for IT enterprise infrastructure management software. They developed the Server & Application Monitor “SAM”, a software very easy to install and use. The tool has a simple dashboard which is intuitive for any experienced IT admin.
Key Features:
- Performance tracking
- Prebuilt reports and audits
- Customizable dashboard widgets
SAM is perfect for monitoring services and performance counters. It can be used to monitor a large variety of applications (+200) from a single dashboard. The dashboard comes pre-configured so that you can easily start the software out-of-the-box with little or no tweaking.
SAM is a great tool for Real-time Monitoring and Management but is also amazing for collecting and reporting data from different agents from a central server.
SAM delivers visibility and performance tracking for all of the important infrastructure that binds running software through to its supporting resources. The service includes an alerting mechanism that triggers warnings when performance thresholds that are placed on the statistics pipeline are crossed. These alerts can be forwarded to technicians by email or SMS notifications and that gives them time to fix problems before users notice.
Pros:
- Supports auto-discovery that builds network topology maps and inventory lists in real-time based on devices that enter the network
- Multiple integrations for alerting and scripted remediation
- Can monitor multiple services and applications including DNS
- Uses drag and drop widgets to customize the look and feel of the dashboard
- Tons of pre-configured templates, reports, and dashboard views
Cons:
- This is a feature-rich enterprise tool designed for sysadmin, non-technical users may some features overwhelming
Official website: http://www.solarwinds.com/server-application-monitor
Download 30 Day Trial FREE: http://www.solarwinds.com/server-application-monitor/register/
Start 30-day Free Trial!
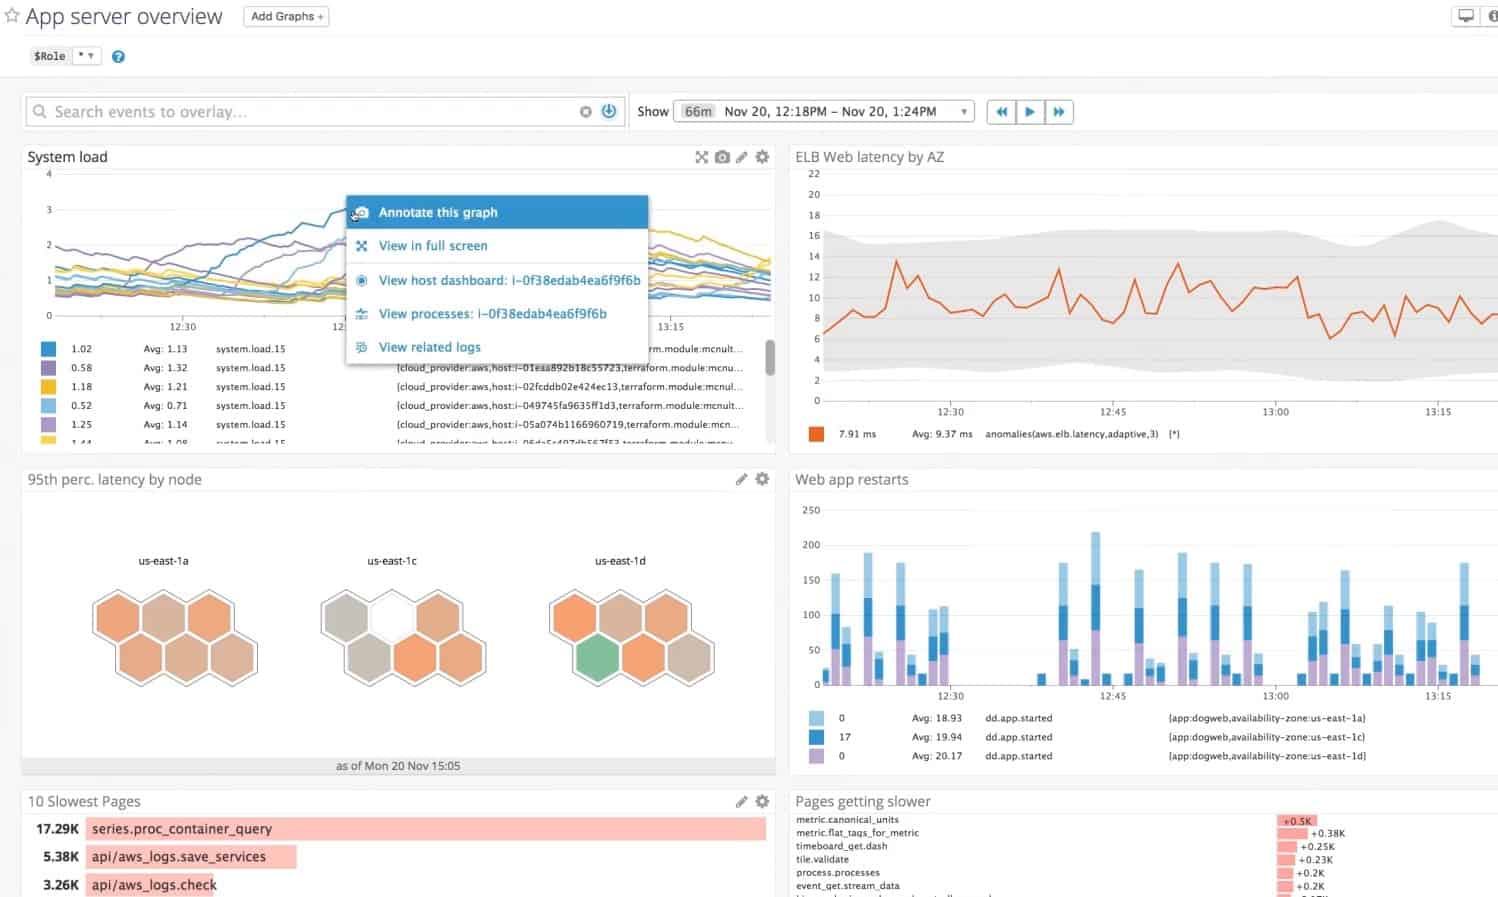
Datadog Infrastructure Monitoring is a cloud-based system that covers servers running Windows and Linux. The server monitoring system identifies all of the key metrics of server performance and displays them live in the Datadog console.
Key Features:
- Highly scalable platform
- Support for local and cloud monitoring
- Root cause analysis
The Data system will consolidate the monitoring of servers from all of your sites and it can also include virtual servers rented in the cloud. The package will unify monitoring for servers of different operating systems.
As well as offering an overview screen of all servers, the system has detailed screen for each server in your system. The package also monitors the performance of the services and applications that run on your servers. This combined view lets you see quickly where the root cause of performance problems lie.
Pros:
- Application dependency mapping
- Full stack views of severe resources up into user-facing software
- Centralized monitoring of servers on multiple sites plus cloud platforms
- Monitoring of servers running Linux and Windows Server
- Customizable monitoring that allows the creation of performance thresholds to trigger alerts
Cons:
- The free trial only lasts for 14 days
Official Website: https://www.datadoghq.com/server-monitoring/
Access a 14-day free trial: https://www.datadoghq.com/free-datadog-trial/
Start 14-day Free Trial!
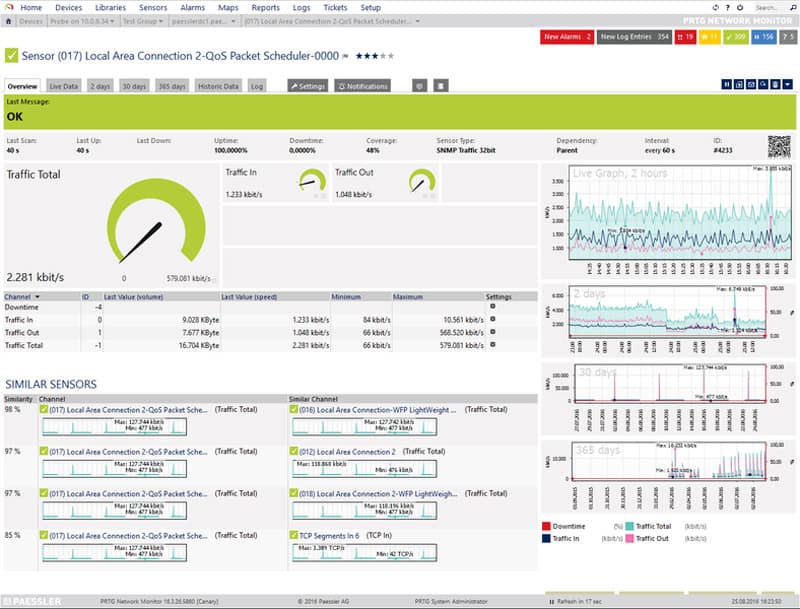
PRTG “Paessler Router Traffic Grapher”, focuses strictly in network infrastructure monitoring. PRTG is able to check on systems, appliances and applications. All of the functionalities from PRTG can be installed with a single installer and without needing to download any add-ons.
Key Features:
- Highly customizable sensors
- Multitenant monitoring
- Simple interface and admin console
PRTG runs on Windows and is able to monitor network availability and utilization using SNMP among other protocols. It is also able to automatically discover systems and devices by analyzing different IP networking segments. From this information
PRTG can create network maps that can be published on the web for easy analysis. You can purchase the basic service PRTG 500 for $1,300, which allows monitoring up to 500 sensors (sensors are aspects monitored on a device).
Pros:
- Uses a combination of packet sniffing, WMI, and SNMP to report network performance as well as discover new devices
- Autodiscovery reflects the latest inventory changes almost instantaneously
- Drag and drop editor makes it easy to build custom views and reports
- Supports a wide range of alert mediums such as SMS, email, and third-party integration
- Supports a freeware version
Cons:
- Is a very comprehensive platform with many features and moving parts that require time to learn
Official Website: https://www.paessler.com/prtg
PRTG 100 Sensors FREE (no Time limitation, etc): https://www.paessler.com/download/
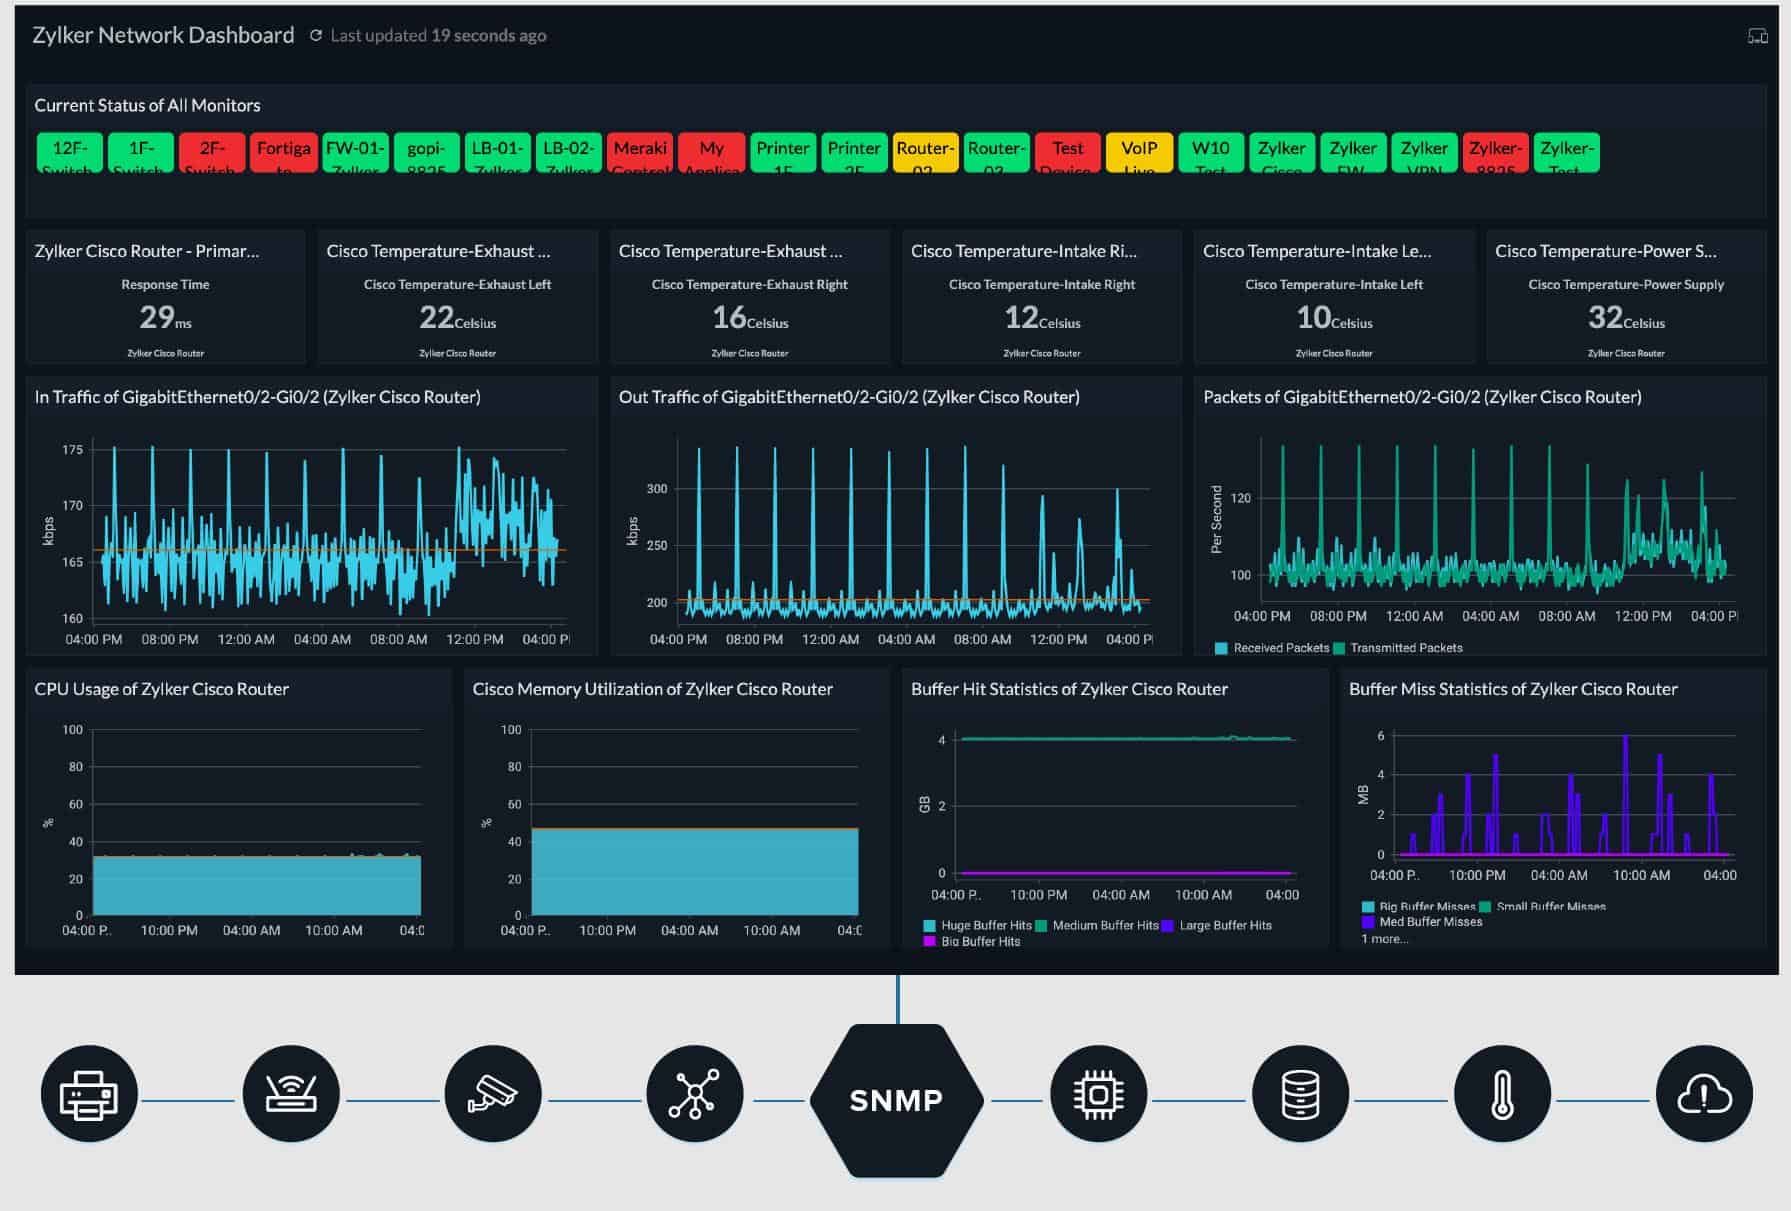
Site24x7 Infrastructure monitors servers running Windows Server. It can also monitor Linux servers. As well as supervising servers, the system can monitor networks and applications. This tool is part of a cloud-based system monitoring platform.
Key Features:
- Prebuilt monitors and reports
- Simple agent deployment
- Flexible pricing
The server monitoring module tracks more than 60 metrics on performance. Topics covered by the monitor include CPU capacity and usage, memory activity, and disk space and usage. The dashboard for the service is hosted on Site24x7 servers in the Cloud, which is where all processing is performed.
The screens for the server monitor include data visualization that shows live reports on activities. The system also displays network activity statistics.
The server monitor sets performance thresholds on each of the statuses that it monitors. When performance drops below one of those thresholds, the system raises an alert, which can also be forwarded to users via SMS, email, voice call, or instant messaging post.
Pros:
- One of the most holistic monitoring tools available, supporting networks, infrastructure, and real user monitoring in a single platform
- Uses real-time data to discover devices and build charts, network maps, and inventory reports
- Is one of the most user-friendly network monitoring tools available
- User monitoring can help bridge the gap between technical issues, user behavior, and business metrics
- Supports a freeware version for testing
Cons:
- Is a very detailed platform that will require time to fully learn all of its features and options
Site24x7 is a subscription service and there are no deposit requirements or the need for a long-term contract with a minimum service period. The Site24x7 Infrastructure service costs $9 per month when paid for annually. IT is available for a 30-day free trial.
Official Website: https://www.site24x7.com/windows-monitoring.html
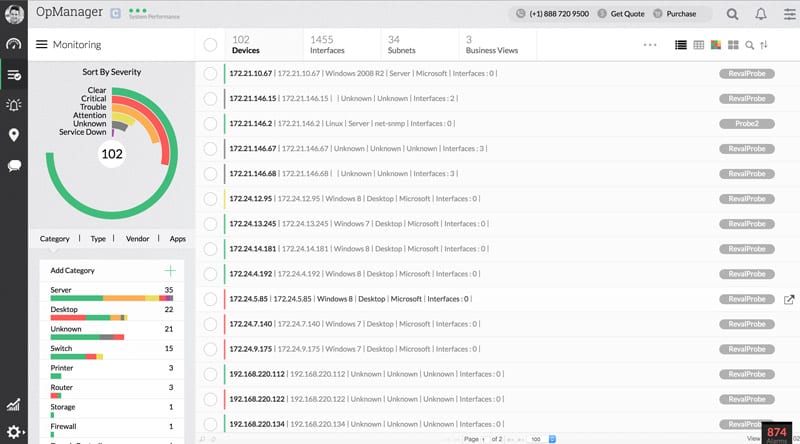
OpManager is a tool by ManageEngine. OpManager helps an administrator keep a close eye on the infrastructure, network and the Application Performance Management “APM”. It can be used for either Windows or Linux environments.
Key Features:
- Customizable SLAs per client
- Simple native graphical reporting
- Autodiscovery of new assets
OpManager is an integrated network management application that allows you to focus on one tool instead of separated networking features. Installing the manager is really easy and once installed it will automatically discover up to 15,000 network interfaces – you can see our full ManageEngine Opmanager review here for more details.
The User Graphical Interface makes it very easy to use and also highly customizable. OpManager best features include Network and Server management, traffic analysis, network configuration management, and fault and performance management.
Pros:
- Designed to work right away, features over 200 customizable widgets to build unique dashboards and reports
- Features traffic management options alongside DPI tools
- Uses intelligent alerting to reduce false positives and eliminate alert fatigue across larger networks
- Supports email, SMS, and webhook for numerous alerting channels
- Can set up SLAs based on network, application, or process.
Cons:
- Is a feature-rich tool that will require a time investment to properly learn
The essential edition, for up to 25 devices can be purchased for $595. We’ve written up an extensive review of ManageEngine Opmanager for you to get a better understanding of its benefits and features. They Offer a 30-day free trial.
Official Site: https://www.manageengine.com/network-monitoring/
Download Now
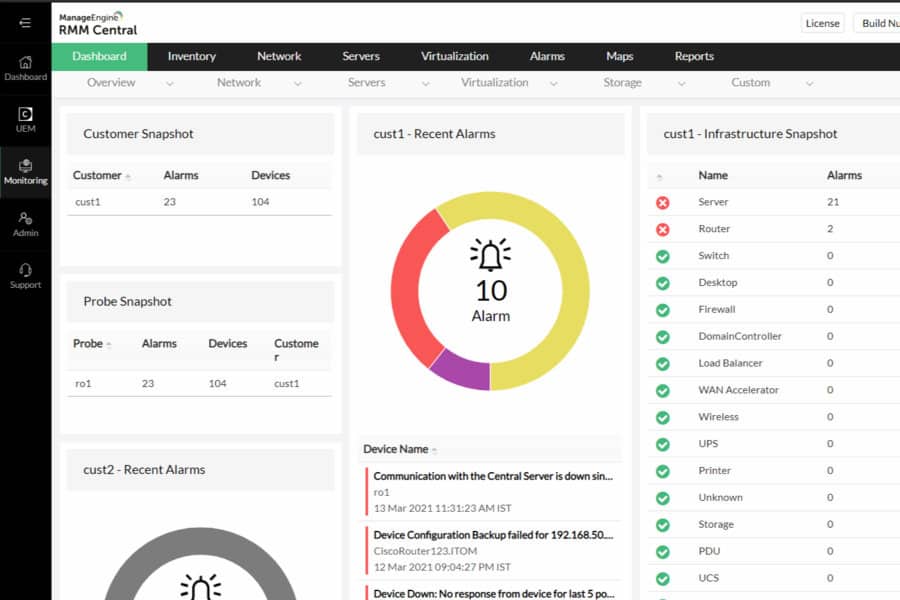
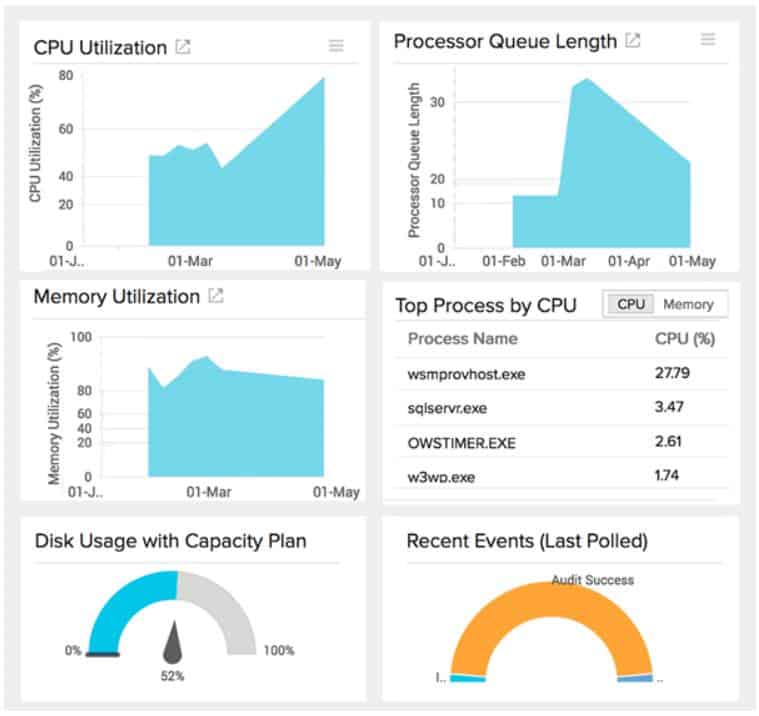
ManageEngine RMM Central offers a simple and scalable solution for Windows system monitoring. Whether you’re monitoring various PCs or looking to keep tabs on vital infrastructure, RMM Central has you covered.
Key Features:
- Machine learning-powered reporting and alerts
- Robust asset management
- Windows patch management with third-party support
Intelligent real-time alerts can keep you updated on system usage specs such as disk space, memory consumption, and more. Administrators can also pair alert thresholds with automation. For example, if disk usage reaches 90% a cleanup script clears all temp files and sends a ticket to the NOC.
Pros:
- Excellent monitoring dashboard, great for MSPs or any size NOC teams
- Automatic asset discovery makes inventory management easy, even on busy networks
- Wide variety of automated remote administration options make it a solid choice for helpdesk support
Cons:
- The platform can take time to explore all of its features and configuration options fully
Official Site: https://www.manageengine.com/remote-monitoring-management/
Start 30-day Free Trial!
9. Nagios XI and Core
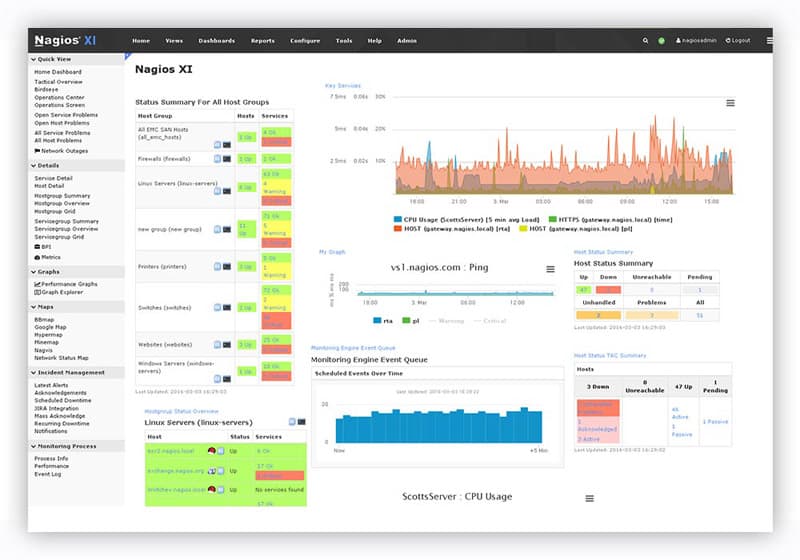
Nagios XI and Nagios Core, are two monitoring tools from Nagios, a leader and standard bearer in IT infrastructure monitoring.
Key Features:
- Robust multitenant management features
- Simple reports and monitoring options
- Open source
Nagios XI is a network monitoring tool that can be highly customized to turn itself into a powerful monitor for isolated or particular circumstances. Nagios XI is easy to install, but it needs to be tweaked a lot to meet your specific needs (Manual Editing of Configuration files, plugins, etc.).
Since the tool does not automatically discover devices, you need to indicate each device through a configuration file, only then, the tool will start sending alerts. Nagios XI can be purchased starting at $1995 for 100 nodes.
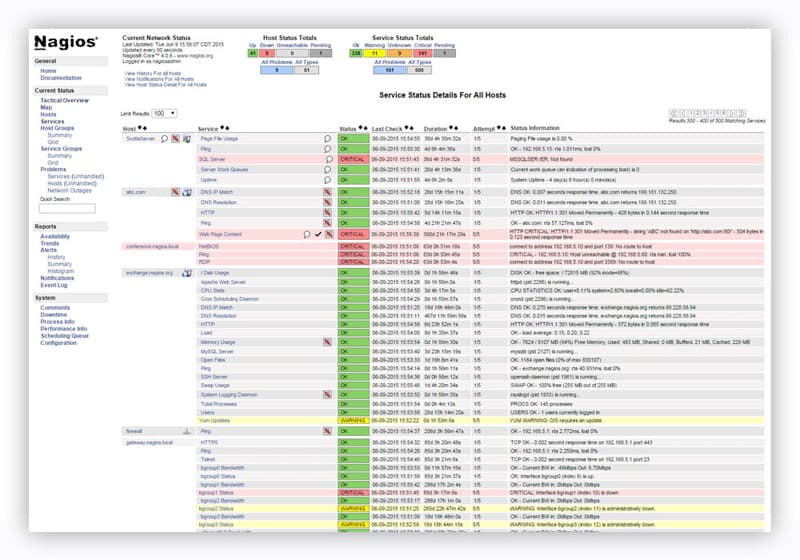
Nagios Core is the free and open-source version. Not to underestimate this freebie, Core is powerful infrastructure monitoring and alerting software. This tool is very easy to download, install and use but of course, it has its limitations, the reporting and user interface are very restricted.
Pros:
- Is open-source and completely free, with a paid option for enterprises
- Supports autodiscovery for easy device management
- Can monitor devices through an additional agent
Cons:
- User interface is lacking, could be easier to use and feature more customizable looks
- Network mapping visualizations need improvement
- Not nearly as comprehensive as some of our top choices
- Must pay extra for support
Nagios XI, uses Nagios Core as its engine. Since Core is open source there are many plugins and add-ons in the community that can work with Nagios XI to extend the capabilities.
Official Website: https://www.nagios.com/products/nagios-xi/
10. WhatsUp Gold
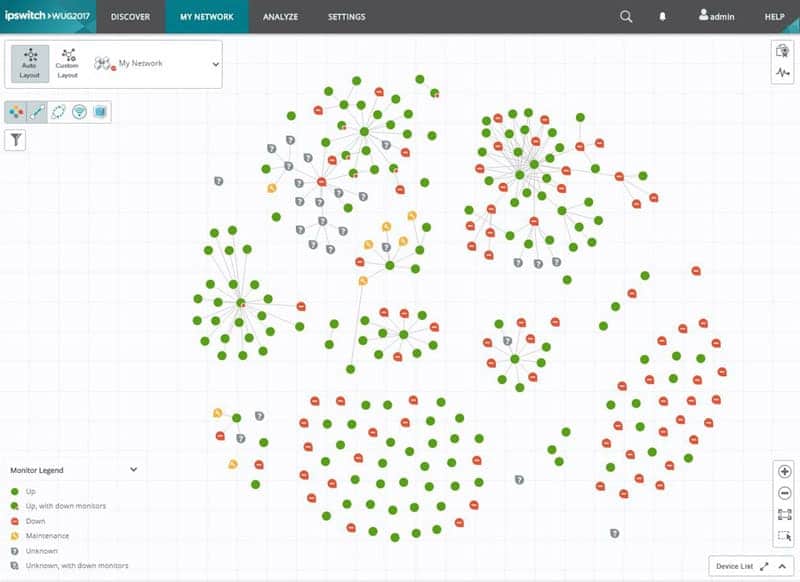
WhatsUp Gold Network monitoring tool from IPSwitch, comes with advanced visualization features that makes the main dashboard really appealing.
Key Features:
- Highly visual reporting
- Modular feature upgrades
- Cloud and local monitoring support
Whatsup Gold allows you to monitor networks, servers, applications, VMs, and traffic flows. The interactive network map lets you visualize the complete network and find problems easily.
Pros:
- Uses simple visualizations to help provide at-a-glance insights
- Supports modular pricing, allowing companies to pay only for features they intend to use
- Can monitor LANs, WANs, and cloud-based applications such as container environments
Cons:
- Modular upgrades might not be a good fit if you intend on utilizing all aspects of a networking monitor
The installation process is really simple; the add-ons can be included right from the start. The basic version can be purchased with a starting fee of $1755 (a one-time license).
Official Website: https://www.ipswitch.com/application-and-network-monitoring/whatsup-gold
11. Zabbix
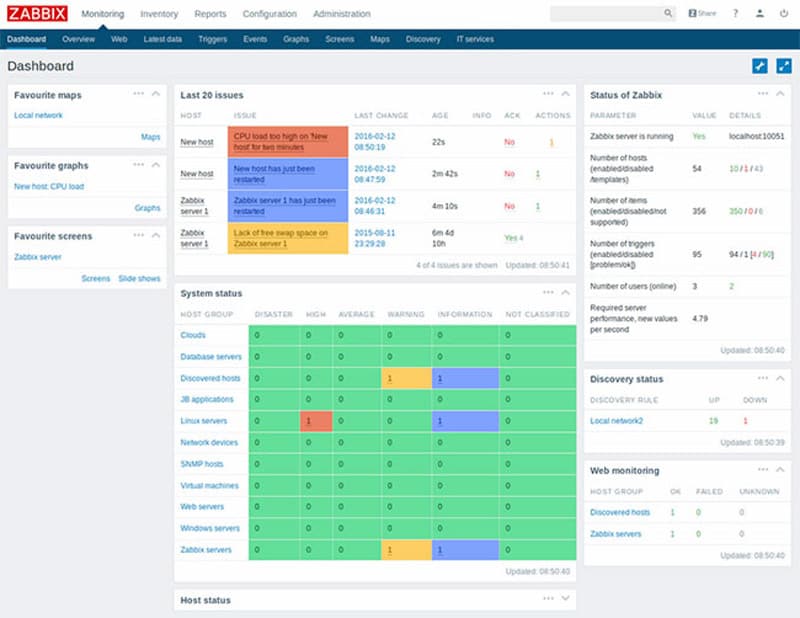
Zabbix is an open-source enterprise and free monitoring tool. It is a great tool for monitoring hosts and services for small to medium networks. But when it comes to large networks, Zabbix can become difficult to scale up, as service discovery becomes complicated.
Key Features:
- Open source
- Collects a wide range of device information
- Integrates well with other products
The tool comes with lightweight agents to install in servers (either Unix or Windows) and can monitor statistics like network utilization, CPU load, memory, etc. The open-source community of Zabbix is really helpful when solving configuration-related issues and customization.
Pros:
- Open-source transparent tool
- Uses both SNMP and ICMP for a broader monitoring range
- Can detect new devices and configuration changes immediately
- Offers useful templates for quick insights
- Robust notification system supports SMS, email, custom script, and webhook
Cons:
- The interface isn’t as intuitive as solutions such as DataDog or Site24x7
- Would like to see better-alerting features, specifically related to reducing false positives
Official Website: http://www.zabbix.com
12. Spiceworks Network Monitor

Spiceworks Network Monitor is another free tool great for small to medium sized Windows networks. The tool allows you to monitor servers, services and devices like routers or switches through SNMP protocol.
Key Features:
- Free tool
- Easy to use
- Simple native reporting
The tool is very easy to install and use. Its graphical interface is very intuitive for anybody with decent knowledge on networks. The downside of the tool is that it lacks customization to create alerts and notifications. Since the tool doesn’t have granularity at the moment of configuration, it is not suitable for large enterprises.
Official Website: https://www.spiceworks.com
Summary
The list above is a careful selection of the top System Monitoring tools that can work in Windows environments. Some tools are perfect for any size network but others are only suitable for small to medium size networks. Some are more expensive than others and some are even free.
It can be overwhelming to choose the right tool, as there are a lot of different IT monitoring vendors and many other options in the market. Before setting to look for a system monitoring tool, is critical to define your current network state, what are the assets that you are trying to keep an eye on? What is the behavior of your network?
Having the right tool for the right type of network could easily help you forecast system failures, keep your servers running smooth and just help save your business’ money.
Best System Monitoring Tools for Windows FAQs
What does a system monitoring tool monitor?
It monitors various aspects of a computer system such as resource usage, performance, and availability.
What are the benefits of using a system monitoring tool?
Improved performance, reliability, and security, early detection of issues, and proactive resolution.
What are the most common system monitoring tools?
Nagios, Zabbix, Datadog, New Relic, and SolarWinds are some of the most popular system monitoring tools.
What should you look for when choosing a system monitoring tool?
Compatibility, scalability, ease of use, cost, and features such as customizability and reporting.
How does a system monitoring tool differ from a log monitoring tool?
System monitoring tools focus on real-time monitoring of system performance and resource usage, while log monitoring tools focus on collecting, analyzing, and alerting on log data generated by systems and applications.


